
Manhattan Avenue
Price/ sq.ft. by trans. (S.A.) inJun
-
Transactions Volume
-
Price by trans
-
Price/ sq.ft. by trans. (S.A.)
-
Price by listing
$7.88M
-$10M
Price sq.ft. by listing
$19,553
- $23,866
/sq.ft.Buy3
Rent/ sq.ft. by trans. (S.A.) inJun
$60/sq.ft.
Rent Volume
1Record(s)
Rent Price by trans
$25,000
-$25,000
Rent/ sq.ft. by trans. (S.A.)
$60
- $60
/sq.ft.Rent by listing
-
Rent sq.ft. by listing
-
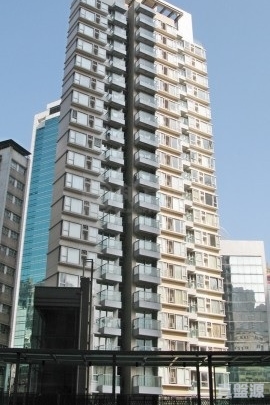
Manhattan Avenue
Estate Info
Estate Overview
Date of Occupation Permit
2003-12
No. of Phases
-
No. of Blocks
1 Block(s)
Total Units
74
Walking toSheung WanStation
4 Min(s)
Address/ Area
253-265 Queen's Road Central
Property Management Company
-
Category
Club
Developer
CHINESE ESTATES HOLDING
Other Facilities
Gymnasium
Manhattan Avenue
Location
Google
精準
Manhattan Avenue
Recommendation
 No Result Found
Manhattan Avenue
Transaction(90 Days)
Data currently unavailableTransaction History
List View
Unit View
FLOOR 31
FLOOR 30
FLOOR 29
FLOOR 28
FLOOR 27
FLOOR 26
FLOOR 25
FLOOR 23
FLOOR 22
FLOOR 21
FLOOR 20
FLOOR 19
FLOOR 18
FLOOR 17
FLOOR 16
FLOOR 15
FLOOR 12
FLOOR 11
FLOOR 10
FLOOR 9
FLOOR 8
FLOOR 7
FLOOR 6
FLOOR 5
FLOOR 3
Relevant News
No Result Found