
Residence Bel-air
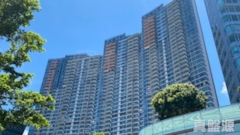
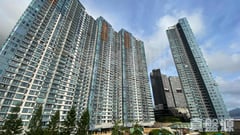

Address28 BEL-AIR AVENUE
Date of Occupation Permit06/2004
Total units108
Floors36
Unit/floor3
School netPrimary18/SecondarySouthern District
DeveloperPACIFIC CENTURY
Property Management Company-
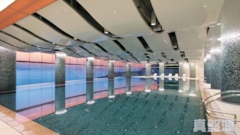
Other FacilitiesSwimming Pool, Children Playground/Play Room, Gymnasium, Table Tennis, Tennis Court, Snooker Room, Karaoke Room, Movie Theater, Reading/Study Room, Library, Computer Room, Beauty Salon, Arome Spa


Buildings
Floor/ Room
FLOOR 43
FLOOR 42
FLOOR 41
FLOOR 40
FLOOR 39
FLOOR 38
FLOOR 37
FLOOR 36
FLOOR 35
FLOOR 33
FLOOR 32
FLOOR 31
FLOOR 30
FLOOR 29
FLOOR 28
FLOOR 27
FLOOR 26
FLOOR 25
FLOOR 23
FLOOR 22
FLOOR 21
FLOOR 20
FLOOR 19
FLOOR 18
FLOOR 17
FLOOR 16
FLOOR 15
FLOOR 13
FLOOR 12
FLOOR 11
FLOOR 10
FLOOR 9
FLOOR 8
FLOOR 7
FLOOR 6
FLOOR 5
FLAT A
Saleable(sqft)
Gross(sqft)
Price
Year
Gain/Loss
858
1033
$6.08M
2003
-
858
1033
$19M
2016
94%
858
1886
$11.18M
2009
23%
864
1035
$4.97M
2003
-
858
1035
$26.96M
2019
218%
858
1035
$9.2M
2009
18%
858
1035
$10.38M
2007
14%
858
1035
$8.95M
2003
-
864
1035
-
-
-
858
1035
$24M
2021
342%
844
1016
$5.24M
2003
-
844
1016
$21.7M
2021
58%
848
1016
$4.98M
2003
-
848
1016
$5.13M
2003
-
844
1016
$8.3M
2004
50%
848
1016
$5.65M
2003
-
844
1016
$22.4M
2020
239%
844
1016
$9.2M
2009
78%
844
1016
$15.75M
2016
55%
844
1016
$4.63M
2003
12%
844
1016
$15.8M
2016
67%
848
1016
$4.47M
2003
-
844
1016
$8M
2005
62%
844
1016
$9.2M
2009
18%
844
1016
$10.06M
2009
6%
844
1016
$23.18M
2020
87%
848
1016
$6.5M
2004
22%
844
1016
$8.78M
2005
22%
844
1016
$14.6M
2011
51%
844
1016
$15.5M
2011
218%
844
1016
$16.5M
2014
242%
844
1016
$18M
2015
29%
844
1016
$11.5M
2010
141%
844
1016
$19M
2020
27%
844
1016
$11.98M
2011
162%
823
992
$4.63M
2003
-
FLAT B
Saleable(sqft)
Gross(sqft)
Price
Year
Gain/Loss
675
825
$4.54M
2003
-
675
825
$7.8M
2009
6%
698
851
$8.51M
2009
-
698
851
$4.35M
2003
-
711
851
$7.28M
2007
-
698
851
$4.24M
2003
-
698
851
$4.08M
2003
-
711
851
-
-
-
711
851
-
-
-
698
851
$4.47M
2004
-
684
855
$4.91M
2003
-
714
855
$8.05M
2004
98%
684
855
$13.8M
2015
100%
684
855
$19.8M
2022
101%
684
855
$19.68M
2021
159%
684
855
$19.8M
2022
35%
684
855
$11.14M
2010
49%
684
855
$7M
2009
-
714
855
$4.43M
2003
-
684
855
$3.87M
2003
-
684
855
$10.28M
2008
21%
684
855
$8.2M
2009
111%
684
855
$12.08M
2011
22%
684
855
$4.53M
2003
-
684
855
$6.5M
2009
56%
684
855
$9.3M
2010
124%
684
855
$19.5M
2021
11%
684
855
$16.5M
2017
136%
684
855
$14M
2016
100%
684
855
$4.56M
2003
-
684
855
$18.3M
2021
12%
684
855
$10.38M
2011
40%
684
855
$12.9M
2015
51%
684
855
$13.68M
2015
44%
684
855
$17.4M
2021
172%
665
832
$3.99M
2003
-
FLAT C
Saleable(sqft)
Gross(sqft)
Price
Year
Gain/Loss
618
775
$11.5M
2011
170%
618
775
$5.2M
2004
60%
618
776
$16.5M
2021
247%
648
776
$6.23M
2005
-
618
776
$15.63M
2020
166%
618
776
$4.95M
2004
52%
618
776
$7.88M
2009
22%
618
776
$18M
2019
36%
618
776
$3.72M
2003
-
618
776
$3.22M
2003
-
618
776
$15.6M
2021
376%
618
776
$13.2M
2017
61%
618
776
$5.38M
2005
3%
618
776
$3.92M
2003
-
618
776
$12.45M
2016
101%
618
776
$12.5M
2015
268%
618
776
$9.22M
2011
101%
648
776
$6.2M
2005
68%
618
776
$3.08M
2003
-
614
776
$8.45M
2008
124%
614
776
$14.18M
2019
297%
614
776
$14.28M
2018
138%
614
776
$13.98M
2022
358%
614
776
$9.1M
2012
52%
614
776
$13.7M
2018
125%
614
776
$7.6M
2008
49%
614
776
$5.38M
2007
51%
614
776
$13.6M
2022
315%
648
776
$3.53M
2003
-
614
776
$5.32M
2007
53%
614
775
$7.3M
2008
39%
614
775
$14.1M
2021
60%
614
775
$11.46M
2015
21%
614
775
$3.73M
2003
-
614
775
$5.1M
2009
15%
598
757
$7.8M
2010
11%