Lohas Park
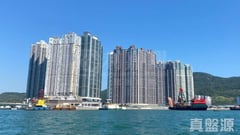
Address1 LOHAS PARK ROAD
Date of Occupation Permit12/2008
Total units216
Floors54
Unit/floor4
School netPrimary95/SecondarySai Kung District
DeveloperNAN FUNG/MTR/CHEUNG KONG
Property Management Company港鐵 - PREMIER MANAGEMENT COM.
Other FacilitiesIndoor Swimming Pool, Jacuzzi, Solarium, Saunna Room, Steam Bath Room, Table Tennis, Snooker Room, Bowling, Movie Theater, Music Room, Reading/Study Room, Judo/Yoga Room
Buildings
Lohas Park Phase 2b Le PrimeTower 6 - L WingTower 6 - R WingTower 7 - L WingTower 7 - R WingTower 8 - L WingTower 8 - R Wing
Floor/ Room
FLOOR 70
FLOOR 69
FLOOR 68
FLOOR 67
FLOOR 66
FLOOR 65
FLOOR 63
FLOOR 62
FLOOR 61
FLOOR 60
FLOOR 59
FLOOR 58
FLOOR 57
FLOOR 56
FLOOR 55
FLOOR 53
FLOOR 51
FLOOR 50
FLOOR 49
FLOOR 48
FLOOR 47
FLOOR 46
FLOOR 45
FLOOR 43
FLOOR 42
FLOOR 41
FLOOR 40
FLOOR 39
FLOOR 38
FLOOR 37
FLOOR 36
FLOOR 35
FLOOR 33
FLOOR 32
FLOOR 31
FLOOR 30
FLOOR 28
FLOOR 27
FLOOR 26
FLOOR 25
FLOOR 23
FLOOR 22
FLOOR 21
FLOOR 20
FLOOR 19
FLOOR 18
FLOOR 17
FLOOR 16
FLOOR 15
FLOOR 12
FLOOR 11
FLOOR 10
FLOOR 9
FLOOR 8
FLAT A
Saleable(sqft)
Gross(sqft)
Price
Year
Gain/Loss
715
938
$5.41M
2008
-
715
938
$4.89M
2011
5%
715
938
$9.33M
2019
81%
715
938
$5.98M
2013
11%
715
956
$6.35M
2016
19%
715
956
$5.88M
2014
15%
715
956
$9.03M
2018
69%
715
956
$10M
2021
87%
715
956
$5.07M
2008
-
715
956
$7.68M
2017
32%
715
956
$4.98M
2011
12%
715
956
$5.75M
2016
8%
715
956
$10.3M
2022
68%
715
956
$5.03M
2008
-
715
956
$5.89M
2013
17%
715
956
$6.25M
2016
19%
715
957
$7.15M
2017
36%
715
957
$9.68M
2021
48%
715
957
$8.63M
2018
44%
715
957
$9.58M
2022
92%
715
957
$7.8M
2023
126%
715
957
$4.78M
2011
8%
715
957
$5.2M
2008
-
715
957
$4.94M
2008
-
715
957
$5.18M
2008
-
761
957
$5.17M
2008
-
715
957
$8M
2022
78%
715
957
$5.15M
2008
-
715
957
$4.91M
2008
-
715
957
$5.57M
2013
9%
761
957
$5.12M
2008
-
715
957
$5.12M
2008
5%
715
957
$7.88M
2023
62%
715
957
$4.2M
2010
18%
715
957
$5.09M
2008
-
715
957
$6.25M
2015
23%
761
957
$5.08M
2008
-
761
957
$5.06M
2008
-
715
957
$5.7M
2014
38%
715
957
$5.04M
2008
-
715
960
$9.3M
2018
69%
715
960
$4.12M
2009
-
763
960
$5.01M
2008
-
715
960
$4.77M
2008
-
715
960
$5M
2008
-
715
960
$5M
2008
-
715
960
$4.98M
2008
-
715
961
$4.72M
2012
5%
715
961
$4.96M
2008
-
715
961
$4.78M
2012
3%
715
962
$4.94M
2008
-
765
962
$4.69M
2008
-
715
962
$4.9M
2008
-
715
962
$4.4M
2012
10%
FLAT B
Saleable(sqft)
Gross(sqft)
Price
Year
Gain/Loss
681
903
$7M
2017
71%
681
903
$5.4M
2014
6%
681
903
$3.8M
2009
25%
681
903
$5.7M
2014
13%
718
903
$4.8M
2008
-
681
903
$9.42M
2022
13%
718
903
$4.79M
2008
-
681
903
$5.02M
2008
-
681
903
$8.78M
2018
48%
681
903
$5M
2008
-
681
903
$9.15M
2020
93%
681
903
$7.82M
2017
33%
681
903
$8.65M
2023
74%
681
903
$4.73M
2008
-
681
903
$8.1M
2018
45%
681
903
$5.96M
2016
20%
681
903
$6.48M
2016
31%
681
903
$8.9M
2020
80%
681
903
$4.93M
2008
-
681
903
$4.93M
2008
-
681
903
$8.65M
2020
40%
681
903
$4.7M
2011
4%
681
903
$4.89M
2008
-
718
903
$4.65M
2008
-
681
903
$5.98M
2015
23%
681
903
$6.2M
2015
27%
681
903
$4.63M
2008
-
681
903
$7M
2017
44%
681
903
$7.23M
2022
15%
681
0
$4.83M
2008
-
681
903
$5.88M
2016
22%
681
903
$7.3M
2024
42%
681
903
$5.78M
2014
26%
681
903
$4.33M
2010
10%
681
903
$6.52M
2016
63%
681
903
$6M
2015
25%
718
903
$4.56M
2008
-
681
903
$5M
2014
22%
681
903
$4.54M
2008
-
681
903
$8.6M
2021
40%
681
903
$4.75M
2008
-
681
903
$4.74M
2008
-
681
903
$5.53M
2013
38%
681
903
$4.5M
2008
-
681
903
$5.43M
2012
15%
681
903
$4.71M
2008
-
681
903
$6.18M
2015
32%
681
903
$5.85M
2016
58%
681
903
$4.68M
2008
-
681
903
$5.26M
2013
12%
681
903
$8.83M
2021
47%
681
904
$5.13M
2014
16%
681
904
$4.41M
2008
-
681
904
$5.3M
2016
15%
FLAT C
Saleable(sqft)
Gross(sqft)
Price
Year
Gain/Loss
729
960
$5.58M
2008
-
729
960
$5.84M
2008
-
729
960
$9.07M
2023
63%
763
960
$5.82M
2008
-
763
960
$5.53M
2008
-
729
960
$5.99M
2014
9%
763
960
$5.5M
2008
-
729
960
$5.77M
2008
-
729
960
$4.72M
2009
-
729
960
$5.7M
2012
1%
729
960
$5.5M
2011
1%
729
960
$5.46M
2008
-
729
960
$5.71M
2008
-
729
960
$8.48M
2017
49%
729
960
$10.09M
2019
86%
729
960
$5.92M
2012
4%
729
960
$5.4M
2008
-
729
960
$7.1M
2015
25%
729
960
$5.65M
2008
-
729
960
$6.15M
2014
14%
729
960
$6M
2017
9%
763
960
$5.35M
2008
-
729
960
$5.61M
2008
-
729
960
$5.33M
2008
-
729
960
$8M
2020
29%
729
960
$6M
2014
8%
729
960
$8.7M
2020
64%
729
960
$9.03M
2023
14%
729
960
$8.74M
2017
65%
729
960
$5.54M
2008
-
729
960
$8.38M
2017
52%
729
960
$5.52M
2008
-
729
960
$4.75M
2010
26%
729
960
$4.73M
2010
14%
729
960
$9.12M
2021
55%
729
960
$9.8M
2020
79%
763
960
$5.22M
2008
-
729
960
$5.2M
2008
-
729
960
$9.85M
2021
42%
729
960
$8.75M
2020
61%
729
960
$9.85M
2021
82%
729
960
$8.88M
2022
9%
729
960
$5.41M
2008
-
729
960
$5.14M
2008
-
729
960
$5.38M
2008
-
729
960
$5.13M
2008
-
729
960
$7.58M
2017
41%
729
960
$5.35M
2008
-
729
960
$5.34M
2008
-
729
960
$5.33M
2008
-
729
960
$6.01M
2016
13%
729
960
$8.18M
2020
50%
763
960
$5.03M
2008
-
729
960
$4.5M
2012
14%
FLAT D
Saleable(sqft)
Gross(sqft)
Price
Year
Gain/Loss
708
930
$5.98M
2014
28%
708
930
$4M
2009
14%
708
930
$4.88M
2008
-
708
930
$4.86M
2008
-
708
947
$4.85M
2008
-
708
947
$5.33M
2012
10%
708
947
$9.88M
2021
48%
708
947
$4.82M
2008
-
708
947
$10.6M
2018
144%
708
947
$5.95M
2013
24%
708
947
$4.56M
2008
-
708
947
$6.2M
2016
36%
708
947
$5.8M
2014
15%
708
947
$8.23M
2017
73%
708
947
$7.98M
2018
76%
708
947
$4.45M
2010
6%
708
950
$4.73M
2008
-
708
950
$9.68M
2021
15%
708
950
$5.9M
2014
27%
708
950
$4.71M
2008
-
708
950
$6M
2016
22%
708
950
$4.69M
2008
-
708
950
$4.65M
2011
23%
708
950
$4.45M
2008
-
708
950
$5.4M
2012
16%
708
950
$7.8M
2024
76%
708
950
$6.8M
2016
54%
708
950
$7.78M
2023
38%
708
950
$9.38M
2021
113%
708
950
$3.58M
2009
23%
708
950
$5.85M
2014
27%
708
950
$9.32M
2021
155%
708
950
$5.31M
2012
16%
708
950
$4M
2010
13%
708
950
$8.85M
2021
69%
708
950
$6.25M
2015
37%
708
950
$4.56M
2008
-
755
950
$4.54M
2008
-
708
950
$9.68M
2022
2%
708
950
$5.18M
2012
15%
708
952
$4.51M
2008
-
757
952
$4.29M
2008
-
708
952
$4.28M
2008
-
708
952
$4.27M
2008
-
757
952
$4.48M
2008
-
708
952
$4.26M
2008
-
708
952
$5.86M
2015
69%
708
953
$5.9M
2014
20%
708
953
$5.5M
2014
24%
708
953
$4.43M
2008
-
708
956
$6.88M
2015
60%
708
956
$6.22M
2015
41%
708
956
$3.3M
2009
21%
708
956
$4.28M
2011
2%

