
Aria Kowloon Peak

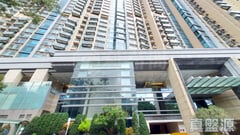
Address51 FUNG SHING STREET
Date of Occupation Permit09/2010
Total units145
Floors30
Unit/floor5
School netPrimary45/SecondaryWong Tai Sin District
DeveloperSUN HUNG KAI
Property Management Company帝譽服務有限公司
Other FacilitiesIndoor Swimming Pool, Swimming Pool, Children Playground/Play Room, Playground/Playroom, Gymnasium, Snooker Room, Barbecue Area, Golf Driving Range, Music Room, Reading/Study Room, Library, Computer Room, Jogging Trail, Ball Room, Aerobic Studio, Arome Spa, Open Lounge


Floor/ Room
FLOOR 39
FLOOR 38
FLOOR 36
FLOOR 35
FLOOR 33
FLOOR 32
FLOOR 31
FLOOR 30
FLOOR 29
FLOOR 28
FLOOR 27
FLOOR 26
FLOOR 25
FLOOR 23
FLOOR 22
FLOOR 21
FLOOR 20
FLOOR 19
FLOOR 18
FLOOR 17
FLOOR 16
FLOOR 15
FLOOR 12
FLOOR 11
FLOOR 10
FLOOR 9
FLOOR 8
FLOOR 7
FLOOR 6
FLOOR 5
FLAT A
Saleable(sqft)
Gross(sqft)
Price
Year
Gain/Loss
3555
4671
$86M
2020
8%
3203
4017
$52.22M
2012
-
1677
2123
$28.62M
2010
-
1677
2123
$29.3M
2011
-
1677
2123
$28.9M
2011
-
1677
2123
$27.7M
2011
-
1677
2123
$24.74M
2010
-
1677
2123
$23.18M
2010
-
1677
2123
$38.7M
2019
62%
1677
2123
$22.39M
2010
-
1677
2123
$25.3M
2014
14%
1677
2123
$29M
2020
33%
1677
2123
$26M
2017
14%
1677
2123
$22.17M
2010
-
1677
2123
$22.75M
2011
-
1677
2123
$23.89M
2011
-
1677
2123
$22.63M
2011
-
1677
2123
$27M
2011
-
1677
2123
$23.53M
2011
-
1677
2123
$22.27M
2011
-
1677
2123
$22.1M
2011
-
1677
2123
$20.94M
2011
-
1677
2123
$23.8M
2017
14%
1677
2123
$24M
2015
-
1677
2123
$20.81M
2012
-
1677
2123
$20.81M
2012
-
1677
2123
$19.74M
2012
-
1668
2115
$27.28M
2021
43%
FLAT B
Saleable(sqft)
Gross(sqft)
Price
Year
Gain/Loss
2385
3000
$39M
2012
-
1164
1478
$20.99M
2011
-
1164
1478
$18.2M
2015
18%
1164
1478
$16.68M
2016
2%
1164
1478
$16.2M
2011
-
1164
1478
$16.15M
2010
-
1164
1478
$14.53M
2010
-
1164
1478
$15.8M
2011
10%
1164
1478
$14.34M
2010
-
1164
1478
$14.59M
2010
-
1164
1478
$14.25M
2010
-
1164
1478
$14.95M
2011
-
1164
1478
$14.47M
2011
-
1164
1478
$14.86M
2011
-
1164
1478
$14.81M
2011
-
1164
1478
$16M
2011
-
1164
1478
$17.8M
2011
-
1164
1478
$15.78M
2011
-
1164
1478
$14.53M
2011
-
1164
1478
$15.59M
2011
-
1164
1478
$14.45M
2011
-
1164
1478
$18.28M
2021
19%
1164
1478
$16.26M
2011
-
1164
1478
$15M
2011
-
1164
1478
$16.1M
2011
-
1164
1478
$17M
2021
7%
1167
1478
$13.6M
2012
-
FLAT C
Saleable(sqft)
Gross(sqft)
Price
Year
Gain/Loss
829
1140
$12.6M
2011
-
758
981
$10.1M
2013
25%
758
981
$10.32M
2017
27%
758
981
$8.07M
2010
-
755
981
$11.5M
2019
44%
755
981
$7.83M
2010
-
755
981
$9M
2017
19%
755
981
$7.39M
2010
-
755
981
$8.32M
2014
14%
755
981
$7.24M
2010
-
755
981
$7.13M
2010
-
755
981
$9.43M
2015
33%
755
981
$9.28M
2015
31%
755
981
$8.1M
2014
15%
755
981
$7.03M
2010
-
755
981
$7.45M
2012
6%
755
981
$6.97M
2010
-
755
981
$8.2M
2014
6%
755
981
$9.88M
2018
43%
755
981
$11.3M
2020
21%
755
981
$6.78M
2010
-
755
981
$10.83M
2021
60%
755
981
$6.73M
2010
-
755
981
$10.8M
2020
37%
755
981
$6.67M
2010
-
755
981
$9.73M
2017
47%
755
981
$6.63M
2010
-
755
981
$6.54M
2010
-
755
981
$8.4M
2015
29%
757
981
$10M
2021
54%
FLAT D
Saleable(sqft)
Gross(sqft)
Price
Year
Gain/Loss
647
912
$8.8M
2011
-
663
866
$9.7M
2019
34%
663
866
$10.13M
2019
42%
663
866
$7.25M
2010
-
663
867
$9.6M
2021
30%
663
867
$6.81M
2010
-
663
867
$6.69M
2010
-
663
867
$6.56M
2010
-
663
867
$7M
2016
4%
663
867
$6.43M
2010
-
663
867
$8.6M
2015
36%
663
867
$7.5M
2016
19%
663
867
$6.29M
2010
-
663
867
$6.26M
2010
-
663
867
$10M
2017
48%
663
867
$7.45M
2014
14%
663
867
$6.19M
2010
-
663
867
$6.17M
2010
-
663
867
$6.14M
2010
-
663
867
$6.98M
2013
2%
663
867
$6.66M
2011
11%
663
867
$6.7M
2011
12%
663
867
$7.25M
2014
21%
663
867
$10M
2021
68%
663
867
$5.93M
2010
-
663
867
$6.21M
2010
-
663
867
$5.89M
2010
-
663
867
$9.38M
2020
30%
663
867
$5.79M
2010
-
663
867
$5.77M
2010
-
FLAT E
Saleable(sqft)
Gross(sqft)
Price
Year
Gain/Loss
913
1301
$15.61M
2011
-
821
1062
$8.88M
2010
-
832
1075
$9.08M
2010
-
830
1073
$9.01M
2010
-
831
1073
$8.95M
2010
-
831
1073
$8.63M
2010
-
831
1073
$8.65M
2010
-
831
1073
$8.32M
2010
-
831
1073
$11.95M
2017
46%
831
1073
$8.16M
2010
-
831
1073
$13.18M
2021
51%
831
1073
$9.4M
2014
17%
831
1073
$7.99M
2010
-
831
1073
$13.08M
2020
64%
831
1073
$11.5M
2017
45%
831
1073
$7.89M
2010
-
831
1073
$7.87M
2010
-
831
1073
$13.08M
2021
67%
831
1073
$11.35M
2017
46%
831
1073
$7.54M
2010
-
831
1073
$7.47M
2010
-
831
1073
$7.63M
2010
-
831
1073
$9.55M
2014
26%
831
1073
$12M
2018
58%
831
1073
$12.98M
2021
39%
831
1073
$11M
2019
47%
831
1073
$12.7M
2020
70%
831
1073
$8.88M
2011
20%
831
1073
$7.36M
2010
-
802
1037
$8M
2012
13%