
Y.i
Price/ sq.ft. by trans. (S.A.) inMay
$21,129/ sq.ft.
Transactions Volume
1Record(s)
Price by trans
$10.48M
-$10.48M
Price/ sq.ft. by trans. (S.A.)
$21,129
- $21,129
/sq.ft.Price by listing
$23M
-$27.5M
Price sq.ft. by listing
$27,363
- $28,485
/sq.ft.Buy3
Rent/ sq.ft. by trans. (S.A.) inMay
-
Rent Volume
-
Rent Price by trans
-
Rent/ sq.ft. by trans. (S.A.)
-
Rent by listing
-
Rent sq.ft. by listing
-
Y.i
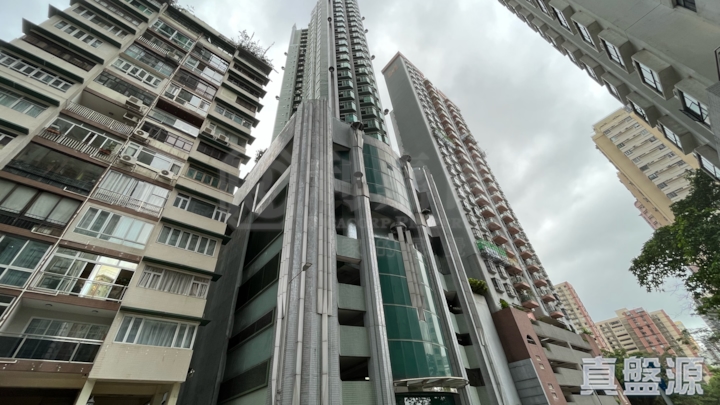
Estate Info
Estate Overview
Date of Occupation Permit
2001-03
No. of Phases
-
No. of Blocks
1 Block(s)
Total Units
70
Walking toTin HauStation
12 Min(s)
Address/ Area
10 Tai Hang Road
School Net
Property Management Company
仲量聯行物業管理有限公司
Category
Club
Developer
YAT DEVELOPMENTS
Other Facilities
Children Playground/Play Room, Squash Court, Basketball Court
Y.i
Location
Google
精準
Y.i
Recommendation
 No Result Found
Y.i
Transaction(90 Days)
Data currently unavailableTransaction History
List View
Unit View
FLOOR 33
FLOOR 32
FLOOR 31
FLOOR 30
FLOOR 29
FLOOR 28
FLOOR 27
FLOOR 26
FLOOR 25
FLOOR 23
FLOOR 22
FLOOR 21
FLOOR 20
FLOOR 19
FLOOR 18
FLOOR 17
FLOOR 16
FLOOR 15
FLOOR 13
FLOOR 12
FLOOR 11
FLOOR 10
FLOOR 9
FLOOR 8
FLOOR 7
Relevant News
No Result Found