Sunrise House
Price/ sq.ft. by trans. (S.A.) inMar
-
Transactions Volume
-
Price by trans
-
Price/ sq.ft. by trans. (S.A.)
-
Price by listing
$13.5M
-$13.5M
Price sq.ft. by listing
$31,323
-$31,323
/sq.ft.Buy1
Rent/ sq.ft. by trans. (S.A.) inMar
-
Rent Volume
-
Rent Price by trans
-
Rent/ sq.ft. by trans. (S.A.)
-
Rent by listing
-
Rent sq.ft. by listing
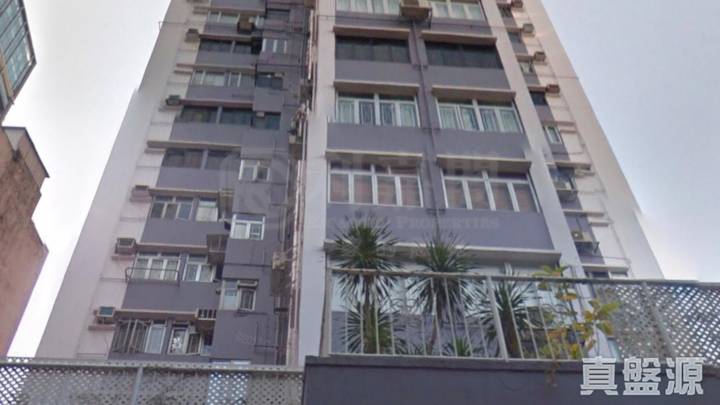
-
Sunrise House
Estate Info
Estate Overview
Date of Occupation Permit
1976-10-1976-10
No. of Phases
-
No. of Blocks
1 Block(s)
Total units
66
Walking toCentralStation
10 Min(s)
Address/ Area
21-31 OLD BAILEY STREET
Property Management Company
-
Category
-
Developer
SUN HUNG KAI
Other Facilities
-
Sunrise House
Location
Sunrise House
Recommendation
No Result Found
Sunrise House
Transaction
Data currently unavailable
Transaction History
Floor/ Room
FLOOR 22
FLOOR 21
FLOOR 20
FLOOR 19
FLOOR 18
FLOOR 17
FLOOR 16
FLOOR 15
FLOOR 14
FLOOR 13
FLOOR 12
FLOOR 11
FLOOR 10
FLOOR 9
FLOOR 8
FLOOR 7
FLOOR 6
FLOOR 5
FLOOR 4
FLOOR 3
FLOOR 2
FLOOR 1
FLAT A
Saleable(sqft)
Gross(sqft)
Price
Year
Gain/Loss
385
582
$7.2M
2015
-
369
472
$4.3M
2010
75%
369
582
-
-
-
462
582
-
-
-
462
582
-
-
-
462
582
$6.8M
2011
85%
0
582
-
-
-
0
582
$2.32M
1996
-
0
582
-
-
-
462
582
-
-
-
462
582
$6.55M
2012
60%
0
582
-
-
-
462
582
$7.8M
2019
420%
462
582
-
-
-
462
582
$8.2M
2019
-
462
582
-
-
-
462
582
-
-
-
462
582
-
-
-
462
600
$4.1M
2010
78%
462
582
$8.25M
2019
64%
462
582
-
-
-
462
582
$8.6M
2012
92%
FLAT B
Saleable(sqft)
Gross(sqft)
Price
Year
Gain/Loss
369
582
$6.8M
2011
265%
369
470
$3.35M
2007
22%
369
582
$8.4M
2015
122%
462
582
$9M
2022
-
462
582
-
-
-
462
582
$1.6M
2001
-
0
582
-
-
-
0
582
-
-
-
462
582
$2.12M
2005
24%
0
582
-
-
-
462
582
$8.3M
2021
-
462
582
-
-
-
462
582
-
-
-
0
582
$2.95M
2006
13%
462
582
$2.68M
2006
9%
462
582
$2.83M
2006
49%
462
582
$8M
2018
-
462
582
$8.6M
2019
170%
462
582
$8.05M
2021
101%
462
582
$6.3M
2013
-
462
582
$8.2M
2021
-
462
568
$11.3M
2021
617%
FLAT C
Saleable(sqft)
Gross(sqft)
Price
Year
Gain/Loss
312
480
$6.2M
2011
172%
312
536
-
-
-
312
536
$1.48M
2001
14%
431
536
-
-
-
431
536
$2.35M
2005
-
431
580
$3.65M
2007
40%
431
536
$7M
2018
-
431
536
$2.75M
2005
25%
431
536
$4.7M
2010
-
0
536
-
-
-
0
536
-
-
-
431
536
$5.75M
2011
62%
431
536
$3.15M
2007
-
431
536
$3.1M
2007
-
431
536
-
-
-
431
500
$5.5M
2015
-
431
536
-
-
-
431
536
$1.74M
1995
-
431
536
$7.88M
2018
91%
431
536
$2.85M
2007
-
431
536
-
-
-
431
536
$3.6M
2007
129%
Relevant News
No Result Found