Soho 189
Price/ sq.ft. by trans. (S.A.) inFeb
$21,395/sq.ft.
Transactions Volume
1Record(s)
Price by trans
$18.25M
-$18.25M
Price/ sq.ft. by trans. (S.A.)
$21,395
-$21,395
/sq.ft.Price by listing
$12M
-$27M
Price sq.ft. by listing
$22,018
-$31,727
/sq.ft.Buy7
Rent/ sq.ft. by trans. (S.A.) inFeb
-
Rent Volume
-
Rent Price by trans
-
Rent/ sq.ft. by trans. (S.A.)
-
Rent by listing
$32,000
-$32,000
Rent sq.ft. by listing
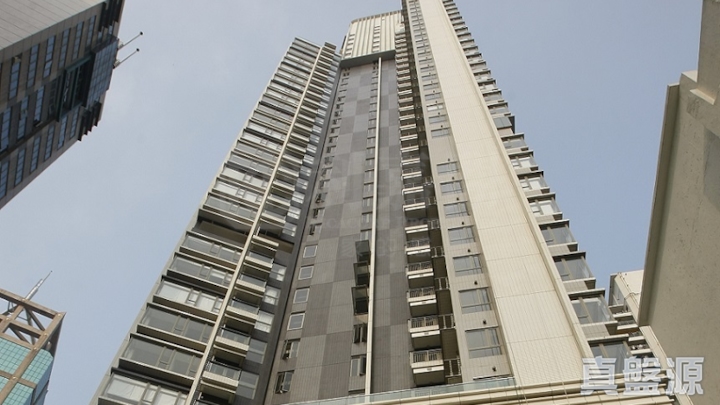
$59
-$59
/sq.ft.Rent1
Soho 189
Estate Info
Estate Overview
Date of Occupation Permit
2012-06-2012-06
No. of Phases
-
No. of Blocks
1 Block(s)
Total units
149
Walking toSai Ying PunStation
1 Min(s)
Address/ Area
189 QUEEN'S ROAD WEST
Property Management Company
嘉里物業管理服務有限公司
Category
Club
Developer
PETERSON GROUP/KERRY PROPERTIES
Other Facilities
Swimming Pool, Children's Pool, Children Playground/Play Room, Gymnasium, Saunna Room, Steam Bath Room, Barbecue Area, Ball Room, Arome Spa, Changing Room
Soho 189
Location
Soho 189
Recommendation
No Result Found
Soho 189
Transaction
Data currently unavailable
Transaction History
Floor/ Room
FLOOR 42
FLOOR 41
FLOOR 40
FLOOR 39
FLOOR 38
FLOOR 37
FLOOR 36
FLOOR 35
FLOOR 33
FLOOR 32
FLOOR 31
FLOOR 30
FLOOR 29
FLOOR 28
FLOOR 27
FLOOR 26
FLOOR 25
FLOOR 23
FLOOR 22
FLOOR 21
FLOOR 20
FLOOR 19
FLOOR 18
FLOOR 17
FLOOR 15
FLOOR 12
FLOOR 11
FLOOR 10
FLOOR 9
FLOOR 8
FLOOR 7
FLOOR 6
FLAT A
Saleable(sqft)
Gross(sqft)
Price
Year
Gain/Loss
1525
2049
$49.61M
2012
-
1516
1941
-
-
-
1567
2012
$62.8M
2016
21%
850
1133
$18M
2011
-
850
1133
$23.24M
2018
33%
850
1133
$20.8M
2020
20%
851
1133
$17.12M
2011
-
851
1133
$16.97M
2011
-
851
1133
$16.82M
2011
-
851
1133
$16.69M
2011
-
851
1133
$16.56M
2011
-
851
1133
$16.43M
2011
-
851
1133
$16.3M
2011
-
853
1135
$16.17M
2011
-
853
1135
$16.04M
2011
-
853
1135
$15.91M
2011
-
853
1135
$20M
2020
5%
853
1135
$15.65M
2011
-
853
1135
$17.7M
2017
14%
853
1135
$22.8M
2019
48%
853
1135
$15.29M
2011
-
853
1135
$15.19M
2011
-
853
1135
$15.09M
2011
-
853
1135
$14.99M
2011
-
853
1135
$14.89M
2011
-
853
1135
$18.25M
2024
22%
853
1135
$14.69M
2011
-
853
1135
$14.59M
2011
-
853
1135
$14.49M
2011
-
853
1135
$14.39M
2011
-
853
1135
$14.29M
2011
-
837
1115
$17.84M
2011
-
FLAT B
Saleable(sqft)
Gross(sqft)
Price
Year
Gain/Loss
1368
1845
$51.66M
2013
-
1365
1753
-
-
-
1366
1753
-
-
-
880
1179
$19.5M
2011
-
882
1179
$25M
2018
28%
882
1179
$22.38M
2020
19%
883
1179
$18.57M
2011
-
883
1179
$18.36M
2011
-
883
1179
$25.8M
2018
42%
883
1179
$22.8M
2017
27%
883
1179
$17.84M
2011
-
883
1179
$23M
2019
18%
883
1179
$17.52M
2011
-
884
1181
$17.36M
2011
-
884
1181
$17.2M
2011
-
884
1181
$17.05M
2011
-
884
1181
$16.89M
2011
-
884
1181
$16.73M
2011
-
884
1181
$16.57M
2011
-
884
1181
$18.98M
2024
16%
884
1181
$16.27M
2011
-
884
1181
$16.14M
2011
-
884
1181
$16.01M
2011
-
884
1181
$15.88M
2011
-
884
1181
$15.75M
2011
-
884
1181
$15.8M
2011
-
884
1181
$15.49M
2011
-
884
1181
$15.36M
2011
-
884
1181
$19M
2023
25%
884
1181
$17.2M
2015
14%
884
1181
$14.97M
2011
-
868
1160
$17.4M
2011
-
FLAT C
Saleable(sqft)
Gross(sqft)
Price
Year
Gain/Loss
1394
1856
$44.8M
2011
-
744
997
$17.8M
2011
-
744
997
$17.4M
2011
-
745
997
$17.1M
2011
-
745
997
$16.9M
2011
-
745
997
$16.7M
2011
-
745
997
$16.52M
2011
-
745
997
$16.34M
2011
-
745
997
$16.16M
2011
-
745
997
$15.98M
2011
-
746
999
$15.8M
2011
-
746
999
$15.62M
2011
-
746
999
$17.6M
2021
14%
746
999
$15.26M
2011
-
746
999
$15.08M
2011
-
746
999
$14.9M
2011
-
746
999
$14.72M
2011
-
746
999
$14.52M
2011
-
746
999
$14.32M
2011
-
746
999
$14.12M
2011
-
746
999
$13.92M
2011
-
746
999
$18.2M
2020
35%
746
999
$13.57M
2011
-
746
999
$13.16M
2011
-
746
999
$12.98M
2011
-
746
999
$12.8M
2011
-
746
999
$12.62M
2011
-
746
999
$16M
2018
29%
730
978
$14.18M
2011
-
FLAT D
Saleable(sqft)
Gross(sqft)
Price
Year
Gain/Loss
552
737
$10.48M
2016
22%
552
737
$13.02M
2011
-
553
737
$12.78M
2011
-
553
737
$12M
2021
5%
553
737
$12.39M
2011
-
553
737
$12.26M
2011
-
553
737
$12.13M
2011
-
553
737
$13.5M
2021
12%
553
737
$15.9M
2018
34%
554
738
$11.78M
2011
-
554
738
$11.66M
2011
-
554
738
$11.54M
2011
-
554
738
$11.42M
2011
-
554
738
$11.3M
2011
-
554
738
$13.3M
2021
19%
554
738
$11.06M
2011
-
554
738
$12.5M
2021
15%
554
738
$10.76M
2011
-
554
738
$10.61M
2011
-
554
738
$10.46M
2011
-
554
738
$12.3M
2023
21%
554
738
$10.21M
2011
-
554
738
$11.6M
2020
18%
554
738
$9.71M
2011
-
554
738
$11.88M
2021
24%
554
738
$11.5M
2021
22%
554
738
$11.5M
2022
24%
554
738
$9.06M
2011
-
FLAT E
Saleable(sqft)
Gross(sqft)
Price
Year
Gain/Loss
544
727
$13.2M
2018
13%
544
727
$12.68M
2013
10%
545
727
$11.35M
2011
-
545
727
$13.09M
2019
16%
545
727
$11.14M
2011
-
545
727
$11.06M
2011
-
545
727
$10.98M
2011
-
545
727
$13.2M
2021
21%
545
727
$13.7M
2019
27%
545
727
$10.74M
2011
-
545
727
$10.66M
2011
-
545
727
$10.59M
2011
-
545
727
$10.51M
2011
-
545
727
$10.43M
2011
-
545
727
$10.35M
2011
-
545
727
$10.27M
2011
-
545
727
$12.6M
2018
24%
545
727
$10.11M
2011
-
545
727
$10.03M
2011
-
545
727
$9.95M
2011
-
545
727
$12M
2022
22%
545
727
$11.4M
2017
15%
545
727
$12.45M
2021
28%
545
727
$9.69M
2011
-
545
727
$9.63M
2011
-
545
727
$9.56M
2011
-
545
727
$9.51M
2011
-
507
678
$11.39M
2011
-
Relevant News
No Result Found