
One Pacific Heights
Price/ sq.ft. by trans. (S.A.) inJun
-
Transactions Volume
-
Price by trans
-
Price/ sq.ft. by trans. (S.A.)
-
Price by listing
$9M
-$16M
Price sq.ft. by listing
$21,333
- $28,169
/sq.ft.Buy6
Rent/ sq.ft. by trans. (S.A.) inJun
-
Rent Volume
-
Rent Price by trans
-
Rent/ sq.ft. by trans. (S.A.)
-
Rent by listing
$29,000
-$29,000
Rent sq.ft. by listing
$55
- $55
/sq.ft.Rent1
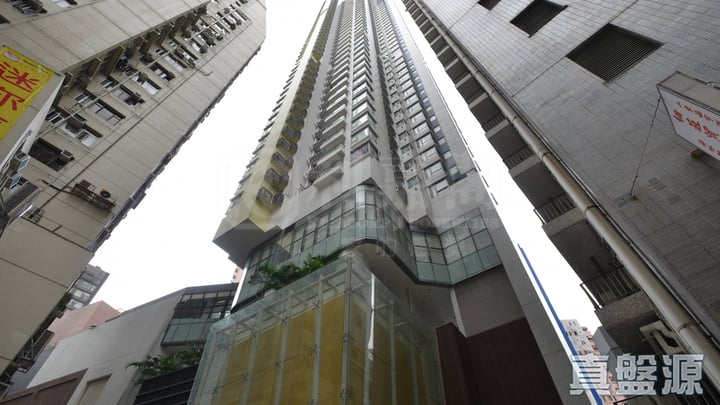
One Pacific Heights
Estate Info
Estate Overview
Date of Occupation Permit
2009-03
No. of Phases
-
No. of Blocks
1 Block(s)
Total Units
155
Walking toSai Ying PunStation
5 Min(s)
Address/ Area
1 Wo Fung Street
Property Management Company
南盈物業管理有限公司
Category
MTR、Club
Developer
PACIFIC CENTURY
Other Facilities
Swimming Pool, Children Playground/Play Room, Gymnasium, Jacuzzi, Solarium, Movie Theater
One Pacific Heights
Location
Google
精準
One Pacific Heights
Recommendation
 No Result Found
One Pacific Heights
Transaction(90 Days)
Data currently unavailableTransaction History
List View
Unit View
FLOOR 49
FLOOR 48
FLOOR 47
FLOOR 46
FLOOR 45
FLOOR 43
FLOOR 42
FLOOR 41
FLOOR 40
FLOOR 39
FLOOR 38
FLOOR 37
FLOOR 36
FLOOR 35
FLOOR 33
FLOOR 32
FLOOR 31
FLOOR 30
FLOOR 29
FLOOR 28
FLOOR 27
FLOOR 26
FLOOR 25
FLOOR 23
FLOOR 22
FLOOR 20
FLOOR 19
FLOOR 18
FLOOR 17
FLOOR 16
FLOOR 15
FLOOR 12
FLOOR 11
FLOOR 10
FLOOR 9
FLOOR 8
FLOOR 7
FLOOR 6
FLOOR 5
Relevant News
No Result Found