
My Central
Price/ sq.ft. by trans. (S.A.) inJun
-
Transactions Volume
-
Price by trans
-
Price/ sq.ft. by trans. (S.A.)
-
Price by listing
$18.5M
-$34.8M
Price sq.ft. by listing
$27,736
- $40,030
/sq.ft.Buy8
Rent/ sq.ft. by trans. (S.A.) inJun
-
Rent Volume
-
Rent Price by trans
-
Rent/ sq.ft. by trans. (S.A.)
-
Rent by listing
$40,000
-$40,000
Rent sq.ft. by listing
$60
- $60
/sq.ft.Rent1
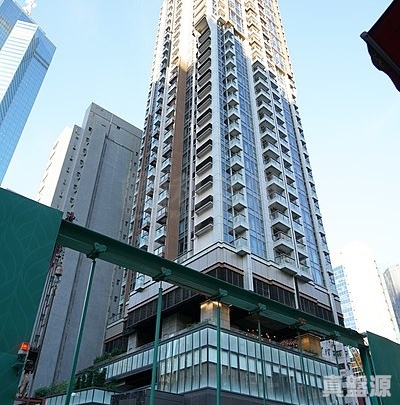
My Central
Estate Info
Estate Overview
Date of Occupation Permit
2018-11
No. of Phases
-
No. of Blocks
1 Block(s)
Total Units
185
Walking toSheung WanStation
6 Min(s)
Address/ Area
23 Graham Street
Property Management Company
港基物業管理有限公司
Category
-
Developer
URBAN RENEWAL AUTHORITY/CHEUNG KONG
Other Facilities
-
My Central
Location
Google
精準
My Central
Recommendation
 No Result Found
My Central
Transaction(90 Days)
Data currently unavailableTransaction History
List View
Unit View
FLOOR 39
FLOOR 38
FLOOR 37
FLOOR 36
FLOOR 35
FLOOR 33
FLOOR 32
FLOOR 31
FLOOR 30
FLOOR 29
FLOOR 28
FLOOR 27
FLOOR 26
FLOOR 25
FLOOR 23
FLOOR 22
FLOOR 21
FLOOR 20
FLOOR 19
FLOOR 18
FLOOR 17
FLOOR 16
FLOOR 15
FLOOR 12
FLOOR 11
FLOOR 10
FLOOR 9
FLOOR 8
FLOOR 7
FLOOR 6
FLOOR 5
Relevant News
No Result Found