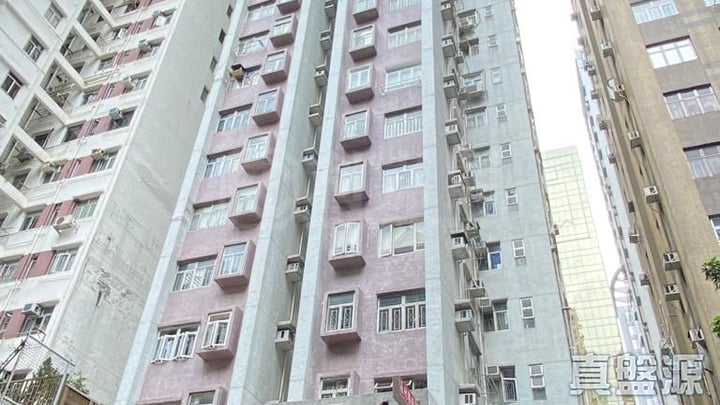
Hon Way Mansion
Price/ sq.ft. by trans. (S.A.) inNov
-
Transactions Volume
-
Price by trans
-
Price/ sq.ft. by trans. (S.A.)
-
Price by listing
$6.7M
-$6.7M
Price sq.ft. by listing
$18,306
-$18,306
/sq.ft.Buy1
Rent/ sq.ft. by trans. (S.A.) inNov
-
Rent Volume
-
Rent Price by trans
-
Rent/ sq.ft. by trans. (S.A.)
-
Rent by listing
-
Rent sq.ft. by listing
-

Hon Way Mansion
Estate Info
Estate Overview
Date of Occupation Permit
1990-02-1990-02
No. of Phases
-
No. of Blocks
1 Block(s)
Total units
119
Walking toQuarry BayStation
2 Min(s)
Address/ Area
11 HOI KWONG STREET
School Net
Property Management Company
-
Category
-
Developer
-
Other Facilities
-
Hon Way Mansion
Location
Hon Way Mansion
Recommendation

Hon Way Mansion
Transaction

Transaction History
Floor/ Room
FLOOR 24
FLOOR 23
FLOOR 22
FLOOR 21
FLOOR 20
FLOOR 19
FLOOR 18
FLOOR 17
FLOOR 16
FLOOR 15
FLOOR 14
FLOOR 13
FLOOR 12
FLOOR 11
FLOOR 10
FLOOR 9
FLOOR 8
FLOOR 7
FLOOR 6
FLOOR 5
FLOOR 4
FLOOR 3
FLOOR 2
FLOOR 1
FLAT A
Saleable(sqft)
Gross(sqft)
Price
Year
Gain/Loss
281
377
-
-
-
281
377
$938K
2004
13%
281
377
$5.38M
2020
38%
281
377
$2.55M
2011
39%
0
377
$1.19M
2007
35%
0
377
-
-
-
281
377
$1.88M
2010
-
281
377
$2.58M
2011
121%
281
377
$4.92M
2018
-
281
377
$2.29M
2011
16%
281
377
$2.05M
2010
-
0
377
$1.31M
1999
-
281
377
$3.1M
2014
270%
281
377
$2M
2010
90%
281
377
$4.9M
2021
172%
0
377
-
-
-
0
377
$1.38M
2007
31%
0
377
$2.07M
1997
-
0
377
$990K
2006
47%
281
377
$1.9M
1997
-
281
377
$2.05M
2010
19%
281
377
$4.6M
2019
102%
281
377
$4.6M
2020
385%
281
377
-
-
-
FLAT B
Saleable(sqft)
Gross(sqft)
Price
Year
Gain/Loss
350
473
$3.8M
2012
90%
350
473
$4M
2014
-
350
473
$1.04M
2003
-
350
473
$4.5M
2016
219%
350
473
$6.75M
2021
14%
350
473
$6.7M
2021
20%
350
473
$4.55M
2014
68%
0
473
$1.83M
1996
-
350
473
$2.56M
2010
9%
350
473
$2.12M
2008
39%
0
473
-
-
-
350
473
$5.03M
2015
73%
350
473
$6.15M
2020
105%
350
473
$1.7M
2009
-
350
473
$2.18M
2010
-
350
473
-
-
-
350
473
$1.82M
2007
21%
350
473
$2.5M
2010
25%
350
473
$1.18M
2005
-
350
473
-
-
-
350
473
$6.38M
2020
71%
350
473
$2.8M
2011
-
350
473
$1.88M
2010
23%
350
473
$2.55M
2009
-
FLAT C
Saleable(sqft)
Gross(sqft)
Price
Year
Gain/Loss
350
476
-
-
-
350
476
$5.5M
2016
185%
350
476
-
-
-
350
476
-
-
-
350
476
$6.1M
2021
-
350
476
$2.63M
1997
-
350
476
$3.9M
2014
71%
350
476
$2.3M
1998
-
350
476
$2.88M
2011
-
350
476
-
-
-
350
476
-
-
-
350
476
$3.88M
2013
99%
350
476
-
-
-
350
476
$2.5M
2010
26%
350
476
-
-
-
350
476
$1.62M
2007
26%
0
476
$1.83M
1996
-
350
476
$2.4M
2010
103%
350
476
$5.8M
2020
-
350
476
$2.5M
2011
11%
0
476
$1.3M
2006
-
350
476
$2.48M
2010
25%
350
476
$5.2M
2017
49%
350
476
$7.08M
2021
172%
FLAT D
Saleable(sqft)
Gross(sqft)
Price
Year
Gain/Loss
366
498
$3M
2012
46%
366
498
$1.55M
2006
14%
366
498
$2.13M
1996
-
366
498
$1.33M
2005
-
366
498
$2.5M
2010
7%
366
498
$7.32M
2020
336%
366
498
$1.5M
2001
32%
366
498
$7.02M
2019
251%
366
498
-
-
-
366
498
$6M
2017
90%
366
498
$1.68M
2007
-
366
498
$6.78M
2021
67%
366
498
$2.16M
2009
7%
366
498
-
-
-
366
498
-
-
-
366
498
-
-
-
366
498
$6.45M
2020
-
366
498
$1.8M
1996
-
366
498
$1.45M
2007
41%
366
498
-
-
-
366
498
$1.77M
2007
18%
366
498
$4.5M
2016
125%
366
498
$1.99M
2009
15%
366
498
$1.83M
1996
-
FLAT E
Saleable(sqft)
Gross(sqft)
Price
Year
Gain/Loss
388
539
$8.18M
2020
234%
388
539
$1.89M
2009
21%
388
539
$2.55M
2008
36%
388
539
$2.29M
2009
16%
388
539
$1.42M
2004
52%
388
539
$3.55M
2011
18%
0
539
$2.79M
1997
-
0
539
$1.9M
2007
39%
0
539
$2.49M
1997
-
388
539
$6.7M
2022
272%
388
539
$6.1M
2023
63%
388
539
$7.27M
2018
51%
0
539
-
-
-
388
539
$3.98M
2012
130%
0
539
$2.21M
1996
-
388
539
$6.52M
2021
616%
388
539
$5.3M
2016
207%
388
539
$6.35M
2021
146%
0
539
$1.9M
1999
27%
0
539
-
-
-
388
539
$2.26M
2010
24%
388
539
$2.08M
2008
52%
388
539
$1.95M
2007
-
Relevant News
