
Garley Building
Price/ sq.ft. by trans. (S.A.) inMay
-
Transactions Volume
-
Price by trans
-
Price/ sq.ft. by trans. (S.A.)
-
Price by listing
$5.2M
-$5.8M
Price sq.ft. by listing
$17,576
- $19,847
/sq.ft.Buy3
Rent/ sq.ft. by trans. (S.A.) inMay
-
Rent Volume
-
Rent Price by trans
-
Rent/ sq.ft. by trans. (S.A.)
-
Rent by listing
$17,000
-$17,000
Rent sq.ft. by listing
$52
- $52
/sq.ft.Rent1
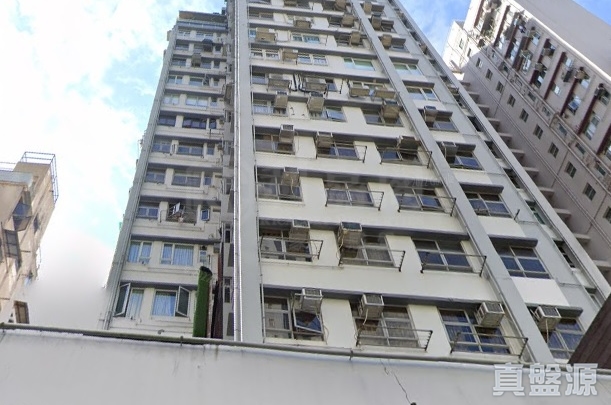
Garley Building
Estate Info
Estate Overview
Date of Occupation Permit
1985-10
No. of Phases
-
No. of Blocks
1 Block(s)
Total Units
118
Walking toSheung WanStation
11 Min(s)
Address/ Area
45-53A Graham Street
Property Management Company
-
Category
-
Developer
-
Other Facilities
-
Garley Building
Location
Google
精準
Garley Building
Recommendation
 No Result Found
Garley Building
Transaction(90 Days)
Data currently unavailableTransaction History
List View
Unit View
FLOOR 22
FLOOR 21
FLOOR 20
FLOOR 19
FLOOR 18
FLOOR 17
FLOOR 16
FLOOR 15
FLOOR 14
FLOOR 13
FLOOR 12
FLOOR 11
FLOOR 10
FLOOR 9
FLOOR 8
FLOOR 7
FLOOR 6
FLOOR 5
FLOOR 4
FLOOR 3
FLOOR 2
Relevant News
No Result Found