
Hatton Place
Price/ sq.ft. by trans. (S.A.) inMar
-
Transactions Volume
-
Price by trans
-
Price/ sq.ft. by trans. (S.A.)
-
Price by listing
$38M
-$41.8M
Price sq.ft. by listing
$32,285
-$35,514
/sq.ft.Buy3
Rent/ sq.ft. by trans. (S.A.) inMar
-
Rent Volume
-
Rent Price by trans
-
Rent/ sq.ft. by trans. (S.A.)
-
Rent by listing
$50,000
-$63,000
Rent sq.ft. by listing
$42
-$54
/sq.ft.Rent3


Hatton Place
Estate Info
Estate Overview
Date of Occupation Permit
1989-03-1989-03
No. of Phases
-
No. of Blocks
1 Block(s)
Total units
38
Walking toHKUStation
15 Min(s)
Address/ Area
1A PO SHAN ROAD
Property Management Company
-
Category
-
Developer
-
Other Facilities
Swimming Pool, Landscape Garden
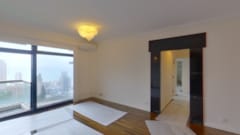
Hatton Place
Location
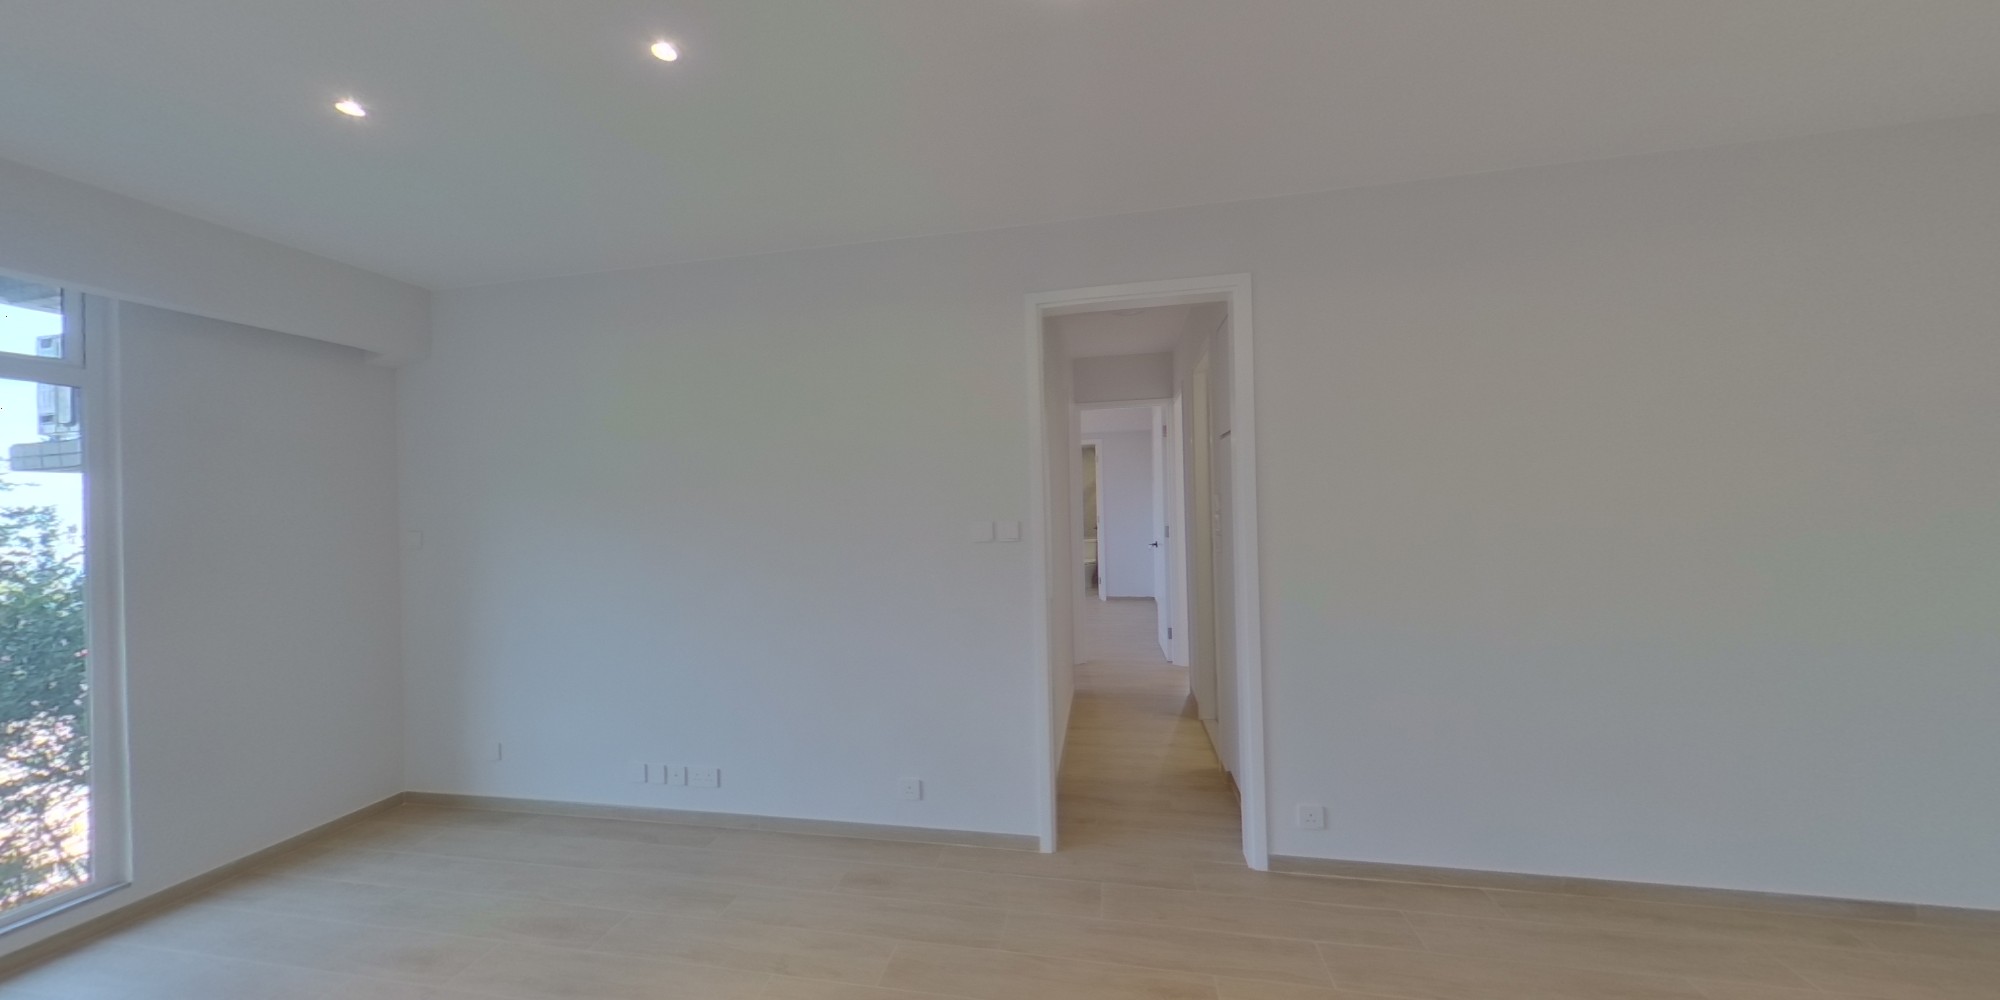
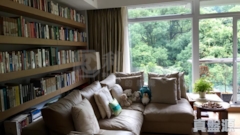
Hatton Place
Recommendation

HATTON PLACE3Rooms2Living Room(s)
Saleable
1,177sq.ft.
Gross
1,538sq.ft.
$
38 M
HATTON PLACE3Rooms2Living Room(s)
Saleable
1,177sq.ft.
Gross
1,538sq.ft.
$
38 M
HATTON PLACE3Rooms2Living Room(s)
Saleable
1,177sq.ft.
Gross
1,538sq.ft.
$
38 M
HATTON PLACE3Rooms2Living Room(s)
Saleable
1,177sq.ft.
Gross
1,538sq.ft.
$
38 M
HATTON PLACE3Rooms
Saleable
1,177sq.ft.
Gross
1,538sq.ft.
$
41.8 M
HATTON PLACE3Rooms
Saleable
1,177sq.ft.
Gross
1,538sq.ft.
$
41.8 M
Hatton Place
Transaction
 Data currently unavailable
Transaction History
Floor/ Room
FLOOR 10
FLOOR 9
FLOOR 8
FLOOR 7
FLOOR 6
FLOOR 5
FLOOR 4
FLOOR 3
FLOOR 2
FLOOR 1
FLOOR G
L/G
FLAT A
Saleable(sqft)
Gross(sqft)
Price
Year
Gain/Loss
2393
3117
$23M
1996
-
1177
1538
$23M
2011
21%
1177
1538
$14M
1997
-
1177
1538
-
-
-
1177
1538
$9M
1998
-
1177
1538
$16.8M
1997
28%
1177
1538
$25M
2013
-
1177
1538
-
-
-
1177
1538
$28.8M
2017
144%
1177
1538
$11.2M
1996
-
FLAT B
Saleable(sqft)
Gross(sqft)
Price
Year
Gain/Loss
2393
3117
$34.2M
1997
-
1216
1579
-
-
-
1216
1579
$7.4M
2002
-
1216
1579
$24.08M
2012
25%
1216
1579
$10.5M
2001
-
1216
1579
$25.5M
2011
143%
1216
1579
$35M
2021
49%
1216
1579
$41.48M
2019
126%
1216
1579
$12.45M
1996
-
1216
1579
$19.99M
2010
48%
FLAT C
Saleable(sqft)
Gross(sqft)
Price
Year
Gain/Loss
1177
1538
-
-
-
1177
1538
-
-
-
1177
1538
$13M
2006
-
1177
1538
$26.8M
2015
123%
1177
1538
$13.9M
2006
9%
1177
1538
$19.7M
2010
103%
1177
1538
-
-
-
1177
1538
$13.33M
2007
6%
1177
1538
-
-
-
FLAT D
Saleable(sqft)
Gross(sqft)
Price
Year
Gain/Loss
1216
1579
$10.38M
2004
-
1216
1579
$18.2M
2009
26%
1216
1579
$12.8M
2006
71%
1216
1579
-
-
-
1216
1579
$24.5M
2011
93%
1216
1579
$19M
2010
-
1216
1579
$12.63M
2006
84%
1216
1579
$8.5M
1998
-
1216
1579
$9.1M
2004
-
Relevant News
No Result Found