
The Valley View
Price/ sq.ft. by trans. (S.A.) inApr
$14,085/sq.ft.
Transactions Volume
1Record(s)
Price by trans
$6M
-$6M
Price/ sq.ft. by trans. (S.A.)
$14,085
-$14,085
/sq.ft.Price by listing
$7.9M
-$8.38M
Price sq.ft. by listing
$18,458
-$19,671
/sq.ft.Buy3
Rent/ sq.ft. by trans. (S.A.) inApr
-
Rent Volume
-
Rent Price by trans
-
Rent/ sq.ft. by trans. (S.A.)
-
Rent by listing
-
Rent sq.ft. by listing
-
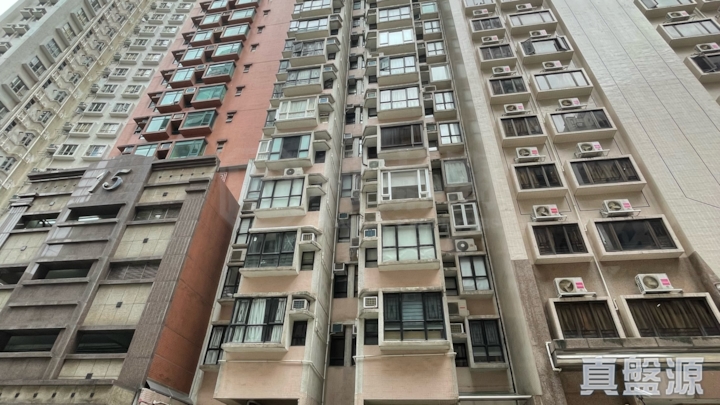
The Valley View
Estate Info
Estate Overview
Date of Occupation Permit
1992-08-1992-08
No. of Phases
-
No. of Blocks
1 Block(s)
Total units
56
Walking To MTR Station
-
Address/ Area
12 TSUI MAN STREET
School Net
Property Management Company
-
Category
-
Developer
-
Other Facilities
-
The Valley View
Location
The Valley View
Recommendation
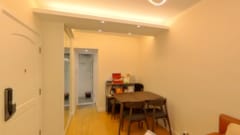

THE VALLEY VIEW2Rooms
Saleable
426sq.ft.
Gross
673sq.ft.
$
8.38 M
THE VALLEY VIEW2Rooms
Saleable
426sq.ft.
Gross
673sq.ft.
$
8.38 M
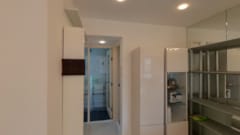
THE VALLEY VIEW2Rooms1Living Room(s)
Saleable
426sq.ft.
Gross
673sq.ft.
$
8 M
THE VALLEY VIEW2Rooms1Living Room(s)
Saleable
426sq.ft.
Gross
673sq.ft.
$
8 M
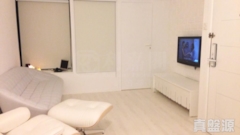
THE VALLEY VIEW2Rooms1Living Room(s)
Saleable
428sq.ft.
Gross
673sq.ft.
$
7.9 M
THE VALLEY VIEW2Rooms1Living Room(s)
Saleable
428sq.ft.
Gross
673sq.ft.
$
7.9 M
The Valley View
Transaction
 Data currently unavailable
Transaction History
Floor/ Room
FLOOR 28
FLOOR 27
FLOOR 26
FLOOR 25
FLOOR 24
FLOOR 23
FLOOR 22
FLOOR 21
FLOOR 20
FLOOR 19
FLOOR 18
FLOOR 17
FLOOR 16
FLOOR 15
FLOOR 14
FLOOR 13
FLOOR 12
FLOOR 11
FLOOR 10
FLOOR 9
FLOOR 8
FLOOR 7
FLOOR 6
FLOOR 5
FLOOR 4
FLOOR 3
FLOOR 2
FLOOR 1
FLAT A
Saleable(sqft)
Gross(sqft)
Price
Year
Gain/Loss
426
673
$8.28M
2015
140%
426
673
$6M
2024
24%
426
673
$3.15M
1995
-
426
673
$4.4M
2010
29%
426
673
$8.2M
2021
3%
426
673
-
-
-
426
673
$4.25M
2010
44%
426
673
-
-
-
426
673
$2.4M
2001
-
426
673
-
-
-
426
673
-
-
-
426
673
-
-
-
426
673
$6M
2015
10%
426
673
$1.98M
2001
51%
426
673
$7.8M
2020
191%
0
673
-
-
-
0
673
-
-
-
426
673
-
-
-
426
673
$8M
2020
20%
426
673
$3.08M
2007
17%
426
673
$4.1M
2010
21%
426
673
-
-
-
426
673
$7.08M
2017
92%
426
673
$5.5M
2012
83%
426
673
$5.2M
2012
51%
426
673
$5.95M
2013
61%
426
673
$2.08M
1999
17%
404
662
-
-
-
FLAT B
Saleable(sqft)
Gross(sqft)
Price
Year
Gain/Loss
426
673
$4.48M
2008
-
426
673
$3.18M
1996
-
426
673
$3.28M
2007
24%
426
673
$2.98M
1996
-
426
673
$8.38M
2019
27%
426
673
$7.3M
2015
14%
426
673
-
-
-
426
673
-
-
-
426
673
$6.4M
2013
-
426
673
$3.39M
2007
61%
426
673
-
-
-
426
673
-
-
-
426
673
$6.48M
2014
188%
426
673
$8.03M
2018
49%
426
673
$4.04M
2008
91%
0
673
-
-
-
426
673
$2.53M
1995
-
426
673
$4.85M
2011
23%
426
673
$7.7M
2019
183%
426
673
$2.22M
2000
18%
426
673
$4.55M
2010
21%
426
673
$7.82M
2021
78%
426
673
$7.88M
2019
24%
426
673
$6.9M
2016
70%
426
673
$3.95M
1997
51%
428
673
$5.6M
2012
130%
428
673
$6M
2012
94%
406
665
$7.65M
2021
145%
Relevant News
No Result Found