Elite's Place
Price/ sq.ft. by trans. (S.A.) inMar
$17,917/sq.ft.
Transactions Volume
2Record(s)
Price by trans
$7.9M
-$10.68M
Price/ sq.ft. by trans. (S.A.)
$17,174
-$18,510
/sq.ft.Price by listing
$9.1M
-$9.1M
Price sq.ft. by listing
$19,783
-$19,783
/sq.ft.Buy1
Rent/ sq.ft. by trans. (S.A.) inMar
-
Rent Volume
-
Rent Price by trans
-
Rent/ sq.ft. by trans. (S.A.)
-
Rent by listing
-
Rent sq.ft. by listing
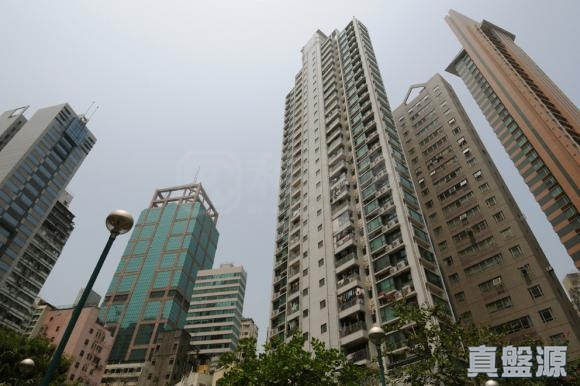
-
Elite's Place
Estate Info
Estate Overview
Date of Occupation Permit
2003-08-2003-08
No. of Phases
-
No. of Blocks
1 Block(s)
Total units
108
Walking toSai Ying PunStation
2 Min(s)
Address/ Area
68-82 KO SHING STREET
Property Management Company
黃開基測計師行(物業管理)公司
Category
Club
Developer
BILLION DEVELOPMENT
Other Facilities
Swimming Pool, Gymnasium, Foot Massage, Changing Room
Elite's Place
Location
Elite's Place
Recommendation
No Result Found
Elite's Place
Transaction
Data currently unavailable
Transaction History
Floor/ Room
FLOOR 33
FLOOR 32
FLOOR 31
FLOOR 30
FLOOR 29
FLOOR 28
FLOOR 27
FLOOR 26
FLOOR 25
FLOOR 23
FLOOR 22
FLOOR 21
FLOOR 20
FLOOR 19
FLOOR 18
FLOOR 17
FLOOR 16
FLOOR 15
FLOOR 12
FLOOR 11
FLOOR 10
FLOOR 9
FLOOR 8
FLOOR 7
FLOOR 6
FLOOR 5
FLOOR 3
FLAT A
Saleable(sqft)
Gross(sqft)
Price
Year
Gain/Loss
616
893
$3.06M
2003
-
617
893
$6.1M
2010
92%
616
893
$3.52M
2004
-
616
893
$3.43M
2004
-
616
893
$4.25M
2007
22%
616
893
$3.22M
2004
-
616
893
$3.38M
2004
-
616
893
$3.41M
2004
-
616
893
$2.92M
2004
-
616
893
$2.77M
2004
-
616
893
$2.63M
2003
-
616
893
$2.7M
2003
-
616
893
$2.47M
2003
-
616
893
$2.69M
2003
-
616
893
$5.5M
2009
105%
616
893
$2.55M
2003
-
616
893
$2.5M
2003
-
616
893
$2.49M
2003
-
616
893
$2.58M
2004
-
616
893
$2.36M
2003
-
616
893
$2.27M
2003
-
616
893
$2.53M
2003
-
616
893
$2.4M
2003
-
616
893
$2.35M
2003
-
616
893
$2.3M
2003
-
617
893
$6.8M
2012
89%
577
893
$12.48M
2021
388%
FLAT B
Saleable(sqft)
Gross(sqft)
Price
Year
Gain/Loss
616
893
$5.2M
2007
45%
616
893
$13.95M
2021
27%
616
893
$3.19M
2004
-
616
893
$10.7M
2015
80%
617
893
$4.03M
2006
31%
617
893
$7.6M
2012
147%
616
893
$3M
2003
-
616
893
$2.71M
2003
-
616
893
$2.94M
2003
-
616
893
$9.2M
2014
130%
616
893
$2.84M
2003
-
616
893
$13M
2021
184%
616
893
$2.64M
2003
-
616
893
$12.4M
2021
230%
617
893
$5.76M
2010
54%
616
893
$2.45M
2003
-
616
893
$2.37M
2003
-
616
893
$2.51M
2003
-
616
893
$2.5M
2004
-
617
893
$11M
2019
81%
616
893
$4.7M
2009
88%
616
893
$2.44M
2003
-
617
893
$9.68M
2015
168%
616
893
$10M
2020
312%
617
893
$6M
2011
169%
616
893
$2.58M
2004
-
577
893
$10.68M
2024
232%
FLAT C
Saleable(sqft)
Gross(sqft)
Price
Year
Gain/Loss
460
640
$9.9M
2020
215%
460
640
$2.24M
2003
-
460
640
$2.35M
2004
-
460
640
$8.8M
2023
112%
460
640
$7.8M
2015
238%
460
640
$2.27M
2004
-
460
640
$8.33M
2017
81%
460
640
$5.7M
2011
159%
460
640
$9.9M
2021
155%
460
640
$3.2M
2007
25%
460
640
$1.99M
2003
-
460
640
$4.1M
2010
111%
460
640
$9.33M
2020
427%
460
640
$5M
2011
166%
460
640
$4M
2008
137%
460
640
$2M
2004
12%
460
640
$5.61M
2012
219%
460
640
$1.77M
2004
-
460
640
$1.74M
2003
-
460
640
$8M
2023
406%
460
640
$2.98M
2007
94%
460
640
$1.68M
2003
-
460
640
$1.61M
2003
-
460
640
$1.68M
2003
-
460
640
$7.78M
2023
412%
460
640
$4.02M
2010
111%
422
640
$1.84M
2003
-
FLAT D
Saleable(sqft)
Gross(sqft)
Price
Year
Gain/Loss
460
640
$9.5M
2020
19%
460
640
$4.1M
2010
87%
460
640
$9.98M
2021
222%
460
640
$5.8M
2012
33%
460
640
$2.77M
2006
20%
460
640
$8.28M
2018
73%
460
640
$9.2M
2019
361%
460
640
$1.91M
2003
-
460
640
$2.3M
2004
17%
460
640
$6.45M
2014
132%
460
640
$1.91M
2004
-
460
640
$4M
2010
8%
460
640
$7.9M
2024
350%
460
640
$8.88M
2019
112%
460
640
$1.7M
2003
-
460
640
$8.8M
2019
69%
460
640
$1.71M
2003
-
460
640
$8.73M
2020
430%
460
640
$5.18M
2011
33%
460
640
$1.67M
2003
-
460
640
$1.65M
2003
-
460
640
$8.95M
2021
431%
460
640
$8.7M
2019
438%
460
640
$2.2M
2006
38%
460
640
$1.65M
2003
-
460
640
$3.79M
2010
146%
422
640
$1.88M
2003
-
Relevant News
No Result Found