
The Java
Price/ sq.ft. by trans. (S.A.) inMar
-
Transactions Volume
-
Price by trans
-
Price/ sq.ft. by trans. (S.A.)
-
Price by listing
$7.2M
-$15.8M
Price sq.ft. by listing
$20,261
-$25,515
/sq.ft.Buy6
Rent/ sq.ft. by trans. (S.A.) inMar
-
Rent Volume
-
Rent Price by trans
-
Rent/ sq.ft. by trans. (S.A.)
-
Rent by listing
-
Rent sq.ft. by listing
-


The Java
Estate Info
Estate Overview
Date of Occupation Permit
2011-09-2011-09
No. of Phases
-
No. of Blocks
1 Block(s)
Total units
75
Walking toNorth PointStation
1 Min(s)
Address/ Area
98 JAVA ROAD
School Net
Property Management Company
英皇物業管理(香港)有限公司
Category
Club
Developer
EMPEROR GROUP
Other Facilities
Children Playground/Play Room, Gymnasium, Movie Theater, Music Room
The Java
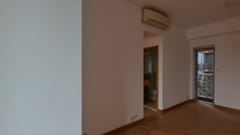
Location
The Java
Recommendation

THE JAVA3Rooms
Saleable
690sq.ft.
Gross
958sq.ft.
$
13.98 M
THE JAVA3Rooms
Saleable
690sq.ft.
Gross
958sq.ft.
$
13.98 M
THE JAVA3Rooms2Living Room(s)
Saleable
690sq.ft.
Gross
958sq.ft.
$
15.8 M
THE JAVA3Rooms2Living Room(s)
Saleable
690sq.ft.
Gross
958sq.ft.
$
15.8 M
THE JAVA2Rooms2Living Room(s)
Saleable
388sq.ft.
Gross
539sq.ft.
$
9.9 M
THE JAVA2Rooms2Living Room(s)
Saleable
388sq.ft.
Gross
539sq.ft.
$
9.9 M
THE JAVA2Rooms1Living Room(s)
Saleable
306sq.ft.
Gross
425sq.ft.
$
7.2 M
THE JAVA2Rooms1Living Room(s)
Saleable
306sq.ft.
Gross
425sq.ft.
$
7.2 M
THE JAVA2Rooms2Living Room(s)
Saleable
344sq.ft.
Gross
477sq.ft.
$
8.3 M
THE JAVA2Rooms2Living Room(s)
Saleable
344sq.ft.
Gross
477sq.ft.
$
8.3 M

THE JAVA2Rooms1Living Room(s)
Saleable
344sq.ft.
Gross
477sq.ft.
$
8.2 M
THE JAVA2Rooms1Living Room(s)
Saleable
344sq.ft.
Gross
477sq.ft.
$
8.2 M
The Java
Transaction
 Data currently unavailable
Transaction History
Floor/ Room
FLOOR 36
FLOOR 35
FLOOR 33
FLOOR 32
FLOOR 31
FLOOR 30
FLOOR 29
FLOOR 28
FLOOR 27
FLOOR 26
FLOOR 25
FLOOR 23
FLOOR 22
FLOOR 21
FLOOR 20
FLOOR 19
FLOOR 18
FLOOR 17
FLOOR 16
FLOOR 15
FLOOR 12
FLOOR 11
FLOOR 9
FLOOR 8
FLOOR 7
FLOOR 6
FLOOR 1
FLAT A
Saleable(sqft)
Gross(sqft)
Price
Year
Gain/Loss
1611
2152
$50M
2023
32%
1623
2197
$48.5M
2023
-
862
1204
$17.24M
2010
-
862
1204
$18.78M
2010
-
862
1204
$16.9M
2010
-
862
1204
$26.6M
2019
59%
862
1204
$16.57M
2010
-
690
956
$16M
2018
22%
690
956
$14.15M
2010
-
690
956
$12.15M
2010
-
690
956
$13.37M
2010
-
690
956
$13.9M
2019
7%
690
956
$11.88M
2010
-
690
956
$12.23M
2010
-
690
956
$11.53M
2011
-
690
956
$11.53M
2010
-
690
956
$13.42M
2012
-
690
956
$11.3M
2010
-
690
956
$11.19M
2010
-
690
956
$12.22M
2012
-
559
775
$8M
2016
2%
559
775
$7.71M
2010
-
559
775
$10.7M
2021
39%
559
775
$7.28M
2012
18%
559
775
$6.86M
2012
-
536
745
$8.48M
2012
21%
FLAT B
Saleable(sqft)
Gross(sqft)
Price
Year
Gain/Loss
864
1205
$22M
2013
-
864
1205
$27M
2018
38%
864
1205
$16.92M
2010
-
864
1205
$16.92M
2010
-
864
1205
$16.58M
2010
-
388
539
$8.74M
2010
-
388
539
$8.57M
2010
-
388
539
$8.74M
2019
8%
388
539
$9.9M
2022
14%
388
539
$7.08M
2015
10%
388
539
$10M
2021
57%
388
539
$7.8M
2017
16%
388
539
$7.76M
2010
-
388
539
$6.29M
2010
-
388
539
$6.92M
2010
-
388
539
$8.08M
2020
31%
388
539
$6.1M
2010
-
388
539
$7.38M
2010
-
344
477
$5.44M
2010
-
344
477
$6.74M
2017
25%
344
477
$7.25M
2020
37%
344
477
$6.98M
2020
18%
344
477
$6M
2022
19%
306
425
$6.75M
2022
30%
FLAT C
Saleable(sqft)
Gross(sqft)
Price
Year
Gain/Loss
690
958
$13.14M
2010
-
690
958
$12.89M
2010
-
690
958
$11.87M
2010
-
690
958
$15.28M
2022
14%
690
958
$11.76M
2010
-
690
958
$10.83M
2010
-
690
958
$11.25M
2010
-
690
958
$14.68M
2022
32%
690
958
$12.8M
2015
22%
690
958
$14.85M
2018
15%
690
958
$14.5M
2021
4%
690
958
$12.58M
2012
11%
690
958
$13.22M
2012
-
344
477
$8.37M
2019
42%
344
477
$7.88M
2022
63%
344
477
$7.5M
2019
32%
344
477
$4.29M
2010
-
344
477
$4.25M
2010
-
306
425
$5.8M
2013
4%
FLAT D
Saleable(sqft)
Gross(sqft)
Price
Year
Gain/Loss
560
777
$7.88M
2010
-
560
777
$7.02M
2010
-
560
777
$7.63M
2010
-
560
777
$8.38M
2017
33%
560
777
$6.5M
2012
-
537
747
$8.35M
2016
6%
Relevant News
No Result Found