
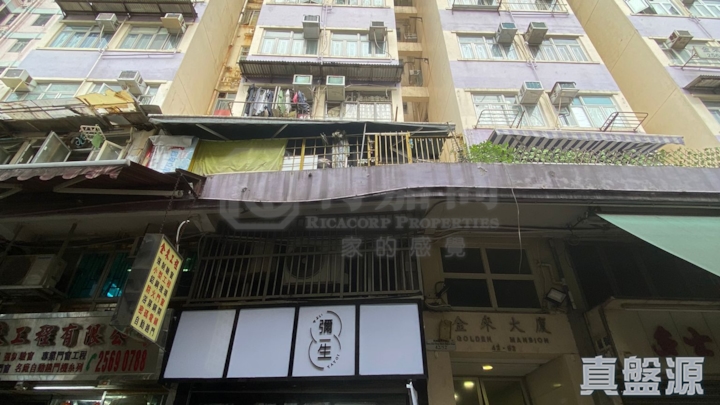
Golden Mansion
Price/ sq.ft. by trans. (S.A.) inMar
-
Transactions Volume
-
Price by trans
-
Price/ sq.ft. by trans. (S.A.)
-
Price by listing
-
Price sq.ft. by listing
-
Rent/ sq.ft. by trans. (S.A.) inMar
-
Rent Volume
-
Rent Price by trans
-
Rent/ sq.ft. by trans. (S.A.)
-
Rent by listing
-
Rent sq.ft. by listing
-
Golden Mansion
Estate Info
Estate Overview
Date of Occupation Permit
1977-10-1977-10
No. of Phases
-
No. of Blocks
1 Block(s)
Total units
216
Walking toShau Kei WanStation
1 Min(s)
Address/ Area
42-52 SHAU KEI WAN MAIN STREET EAST
School Net
Property Management Company
-
Category
-
Developer
-
Other Facilities
-
Golden Mansion
Location
Golden Mansion
Recommendation
 No Result Found
Golden Mansion
Transaction
Data currently unavailableTransaction History
Floor/ Room
FLOOR 20
FLOOR 19
FLOOR 18
FLOOR 17
FLOOR 16
FLOOR 15
FLOOR 14
FLOOR 13
FLOOR 12
FLOOR 11
FLOOR 10
FLOOR 9
FLOOR 8
FLOOR 7
FLOOR 6
FLOOR 5
FLOOR 4
FLOOR 3
FLOOR 2
FLOOR 1
FLAT A
Saleable(sqft)
Gross(sqft)
Price
Year
Gain/Loss
282
0
-
-
-
282
364
$1.18M
1996
-
282
360
$1.58M
2010
34%
282
364
$688K
2001
-
282
364
$4.41M
2021
148%
282
364
-
-
-
282
364
-
-
-
282
364
-
-
-
282
364
$2.83M
2013
-
282
364
-
-
-
282
364
$2.99M
2016
203%
282
364
$2.8M
2016
-
282
364
$4.79M
2018
24%
282
405
$2.76M
2013
75%
282
0
-
-
-
282
364
-
-
-
282
364
$550K
2004
53%
282
0
$1.43M
2010
4%
282
0
-
-
-
FLAT B
Saleable(sqft)
Gross(sqft)
Price
Year
Gain/Loss
295
0
$1.5M
2008
1%
265
338
$790K
2000
-
265
338
$1.08M
1996
-
0
338
-
-
-
265
338
$2.43M
2012
-
0
338
-
-
-
265
338
$1.65M
2010
127%
265
338
$2.3M
2016
51%
0
338
$1.29M
1997
8%
0
338
-
-
-
0
338
-
-
-
0
338
$1.25M
1997
-
0
338
-
-
-
265
338
$850K
2007
42%
265
338
$4M
2018
-
265
338
-
-
-
265
338
$510K
2001
50%
265
380
$400K
2004
63%
265
0
-
-
-
265
0
-
-
-
FLAT C
Saleable(sqft)
Gross(sqft)
Price
Year
Gain/Loss
277
0
$1.51M
2010
9%
277
400
-
-
-
277
0
$1.45M
2010
-
277
0
$2.58M
2013
-
277
0
-
-
-
277
0
$2.14M
2012
127%
277
0
-
-
-
277
352
$1.87M
2011
-
277
0
$1.85M
2012
17%
277
0
$1.78M
1997
46%
277
354
$1.46M
1997
-
277
0
-
-
-
277
389
$4.1M
2021
38%
277
0
$2.98M
2015
-
277
0
-
-
-
277
0
-
-
-
277
0
-
-
-
277
0
-
-
-
277
0
$1.89M
2011
31%
277
354
$4M
2019
201%
FLAT D
Saleable(sqft)
Gross(sqft)
Price
Year
Gain/Loss
315
0
-
-
-
315
389
$3.2M
2013
183%
315
0
$4.76M
2022
33%
315
0
-
-
-
315
405
$1.05M
1999
-
315
0
-
-
-
315
389
$4.8M
2020
502%
315
389
$1.2M
2009
100%
315
405
$3M
2013
293%
315
405
$1.04M
1999
-
315
0
$1.08M
2007
-
315
400
-
-
-
315
0
-
-
-
315
0
-
-
-
315
0
$3.38M
2016
-
315
405
$4.55M
2018
810%
315
405
$1.56M
2010
9%
0
405
-
-
-
315
405
$4.38M
2021
-
315
405
$2.7M
2014
108%
FLAT E
Saleable(sqft)
Gross(sqft)
Price
Year
Gain/Loss
226
0
$3.6M
2018
122%
255
0
-
-
-
255
0
-
-
-
255
0
-
-
-
255
0
-
-
-
255
350
$2.5M
2012
95%
255
314
$1.76M
2010
10%
255
0
$900K
2009
-
255
0
-
-
-
255
0
-
-
-
255
0
-
-
-
255
0
-
-
-
255
0
-
-
-
255
380
$4.05M
2021
575%
255
0
$1.7M
2011
36%
255
0
-
-
-
255
0
$3.6M
2021
-
255
0
$1.02M
1996
-
255
380
$1.08M
1995
-
FLAT F
Saleable(sqft)
Gross(sqft)
Price
Year
Gain/Loss
255
0
-
-
-
231
0
$1.12M
1996
-
264
336
$670K
2001
-
264
0
-
-
-
264
330
$1.3M
1997
15%
264
336
$850K
2007
-
264
336
$3M
2023
199%
264
336
$430K
2003
68%
264
330
$3.85M
2017
179%
264
0
$3.75M
2023
240%
264
251
$1.09M
2009
40%
264
0
-
-
-
264
0
$1.18M
2008
9%
264
0
$3.69M
2021
3%
264
380
$1.39M
2010
32%
264
336
$550K
2004
-
264
336
$1.28M
2009
2%
264
0
$3.78M
2020
22%
264
0
-
-
-
264
336
$950K
2007
-
FLAT H
Saleable(sqft)
Gross(sqft)
Price
Year
Gain/Loss
248
350
$1.4M
2010
94%
248
380
$1.3M
2010
8%
248
0
$500K
2002
-
248
381
$3.05M
2016
30%
248
0
-
-
-
248
316
$2.98M
2024
257%
248
0
$2.47M
2014
54%
248
0
-
-
-
248
0
$460K
2003
-
248
0
$2.1M
2011
64%
248
316
$650K
2001
-
248
0
-
-
-
248
310
$1.34M
2010
235%
248
0
$3.08M
2016
124%
248
0
-
-
-
248
0
$400K
2010
-
248
0
-
-
-
248
0
$3.25M
2017
767%
248
0
$1.7M
2012
21%
FLAT I
Saleable(sqft)
Gross(sqft)
Price
Year
Gain/Loss
392
0
-
-
-
189
0
$1.26M
1997
-
189
0
-
-
-
189
0
-
-
-
189
0
-
-
-
189
0
-
-
-
189
241
$2.36M
2016
21%
189
241
$1.23M
2010
2%
189
241
-
-
-
189
241
$835K
1997
-
189
0
-
-
-
189
0
$2.25M
2016
-
189
0
-
-
-
189
0
$1.51M
2011
11%
189
0
$1.22M
2010
-
189
0
$1.13M
1997
-
189
250
$830K
2008
131%
189
250
-
-
-
189
250
$2.13M
2013
61%
189
0
-
-
-
FLAT J
Saleable(sqft)
Gross(sqft)
Price
Year
Gain/Loss
198
0
$3.2M
2018
870%
198
0
$1.73M
2012
107%
198
0
-
-
-
198
330
$3.53M
2018
-
198
0
-
-
-
198
0
-
-
-
198
260
$3.5M
2018
714%
198
257
$500K
2001
-
198
0
$3.2M
2018
-
198
0
-
-
-
198
0
$430K
2003
57%
198
260
$650K
1999
-
198
257
$2.54M
2024
219%
198
0
$3.28M
2020
82%
198
300
$880K
1996
-
198
257
$1.01M
2008
16%
198
0
$2.5M
2020
400%
198
275
$480K
2004
7%
198
0
$2.58M
2016
-
FLAT G1
Saleable(sqft)
Gross(sqft)
Price
Year
Gain/Loss
144
190
$220K
2003
71%
144
0
$1.33M
2012
-
144
0
$500K
2006
87%
144
187
$330K
2001
-
144
187
-
-
-
144
0
-
-
-
144
0
-
-
-
144
0
-
-
-
144
0
$390K
2006
47%
144
0
$350K
2004
-
144
0
-
-
-
144
0
-
-
-
144
0
$480K
2007
-
144
0
$1.9M
2018
-
144
280
$638K
2007
31%
144
0
-
-
-
144
187
$2.69M
2018
-
144
187
$400K
2006
-
144
187
$2.1M
2019
19%
FLAT G2
Saleable(sqft)
Gross(sqft)
Price
Year
Gain/Loss
165
0
$330K
2003
-
165
0
$3M
2021
52%
165
211
$2.6M
2018
160%
165
0
$290K
2003
-
165
0
-
-
-
165
0
$2.9M
2020
50%
165
300
$332K
2003
-
165
211
$350K
2003
50%
165
211
$1.06M
2011
41%
165
211
-
-
-
165
211
$1.98M
2017
21%
165
211
$2.19M
2015
97%
165
280
$1.05M
2010
5%
165
0
$1.42M
2011
35%
165
0
-
-
-
165
0
$950K
1997
-
165
0
-
-
-
165
211
$830K
2009
3%
165
211
$950K
1997
90%
Relevant News
No Result Found