
Mayland Court
Price/ sq.ft. by trans. (S.A.) inMar
-
Transactions Volume
-
Price by trans
-
Price/ sq.ft. by trans. (S.A.)
-
Price by listing
$3.98M
-$5.08M
Price sq.ft. by listing
$11,339
-$14,640
/sq.ft.Buy2
Rent/ sq.ft. by trans. (S.A.) inMar
-
Rent Volume
-
Rent Price by trans
-
Rent/ sq.ft. by trans. (S.A.)
-
Rent by listing
-
Rent sq.ft. by listing
-
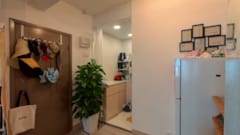
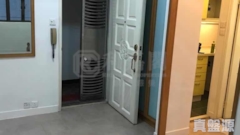
Mayland Court
Estate Info
Estate Overview
Date of Occupation Permit
1976-09-1976-09
No. of Phases
-
No. of Blocks
1 Block(s)
Total units
68
Walking toCauseway BayStation
6 Min(s)
Address/ Area
1-7 SHELTER STREET
School Net
Property Management Company
-
Category
-
Developer
-
Other Facilities
-
Mayland Court
Location

Mayland Court
Transaction
 Data currently unavailable
Transaction History
Floor/ Room
FLOOR 23
FLOOR 22
FLOOR 21
FLOOR 20
FLOOR 19
FLOOR 18
FLOOR 17
FLOOR 16
FLOOR 15
FLOOR 14
FLOOR 13
FLOOR 12
FLOOR 11
FLOOR 10
FLOOR 9
FLOOR 8
FLOOR 7
FLOOR 6
FLOOR 5
FLOOR 4
FLOOR 3
FLOOR 2
FLOOR 1
FLAT A
Saleable(sqft)
Gross(sqft)
Price
Year
Gain/Loss
278
470
-
-
-
321
475
$2.45M
1997
12%
360
475
$2M
2008
16%
347
475
$5.6M
2018
387%
347
475
-
-
-
347
475
-
-
-
347
475
$2.1M
1996
17%
347
475
$5.83M
2018
-
347
475
$4.5M
2019
-
347
475
-
-
-
347
475
-
-
-
347
480
$2.43M
2008
60%
347
0
-
-
-
347
475
$920K
2001
-
347
475
$1.8M
1996
-
347
500
-
-
-
347
0
-
-
-
347
550
$4.75M
2017
-
347
520
$2.5M
2010
37%
347
475
$3.16M
2011
-
347
475
$5.3M
2019
-
347
475
$1.9M
1998
-
347
0
-
-
-
FLAT B
Saleable(sqft)
Gross(sqft)
Price
Year
Gain/Loss
278
0
$5.18M
2020
44%
321
475
$1.79M
1996
-
360
475
$4.84M
2015
23%
347
475
$1.84M
1996
-
347
475
$1.9M
1999
35%
347
475
-
-
-
347
475
$4.65M
2017
-
347
475
$5.5M
2018
141%
347
475
$1.28M
2004
19%
347
0
-
-
-
347
0
-
-
-
347
500
$2.49M
1997
7%
347
475
-
-
-
347
475
$5.5M
2020
143%
347
475
$1.38M
2000
-
347
475
$5.35M
2021
-
347
475
$1.5M
1999
-
347
475
$2.42M
1997
-
347
475
$3.3M
2011
-
347
475
$1.15M
2004
-
347
475
$1.7M
2007
70%
347
475
$1.3M
1999
-
347
0
-
-
-
FLAT C
Saleable(sqft)
Gross(sqft)
Price
Year
Gain/Loss
304
465
$4.12M
2024
-
351
465
$2.31M
1997
-
351
465
$5.78M
2019
140%
351
465
$2.08M
1998
-
351
465
$4.9M
2015
216%
351
465
-
-
-
351
465
$1.25M
2001
-
351
465
$1.86M
2007
16%
351
475
-
-
-
351
500
$2.23M
1998
21%
351
0
$5.95M
2018
25%
351
465
$4M
2016
36%
351
465
$4.55M
2013
-
351
465
$4.5M
2015
-
351
465
$3.75M
2012
-
351
465
$4.56M
2015
93%
351
475
$1.7M
1996
-
351
0
-
-
-
351
0
-
-
-
351
465
-
-
-
351
465
$1.52M
1996
-
351
465
$1.75M
1996
35%
Relevant News
No Result Found