
Caine Tower
Price/ sq.ft. by trans. (S.A.) inJun
-
Transactions Volume
-
Price by trans
-
Price/ sq.ft. by trans. (S.A.)
-
Price by listing
$7.8M
-$9M
Price sq.ft. by listing
$22,901
- $24,451
/sq.ft.Buy2
Rent/ sq.ft. by trans. (S.A.) inJun
-
Rent Volume
-
Rent Price by trans
-
Rent/ sq.ft. by trans. (S.A.)
-
Rent by listing
$23,800
-$23,800
Rent sq.ft. by listing
$61
- $61
/sq.ft.Rent1
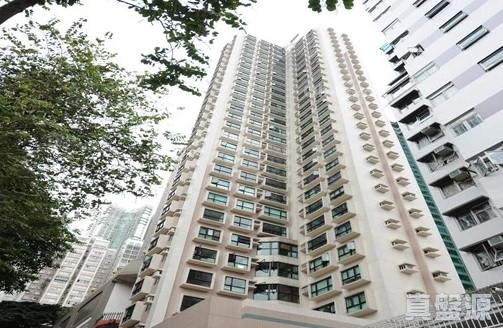
Caine Tower
Estate Info
Estate Overview
Date of Occupation Permit
1999-01
No. of Phases
-
No. of Blocks
1 Block(s)
Total Units
84
Walking toSheung WanStation
11 Min(s)
Address/ Area
55 Aberdeen Street
Property Management Company
-
Category
-
Developer
-
Other Facilities
-
Caine Tower
Location
Google
精準
Caine Tower
Recommendation
 No Result Found
Caine Tower
Transaction(90 Days)
Data currently unavailableTransaction History
List View
Unit View
FLOOR 31
FLOOR 30
FLOOR 29
FLOOR 28
FLOOR 27
FLOOR 26
FLOOR 25
FLOOR 23
FLOOR 22
FLOOR 21
FLOOR 20
FLOOR 19
FLOOR 18
FLOOR 17
FLOOR 16
FLOOR 15
FLOOR 13
FLOOR 12
FLOOR 11
FLOOR 10
FLOOR 9
FLOOR 8
FLOOR 7
FLOOR 6
FLOOR 5
FLOOR 3
FLOOR 2
FLOOR 1
LG1
FLOOR G
Relevant News
No Result Found