
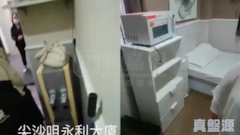
Wing Lee Building
Price/ sq.ft. by trans. (S.A.) inMar
-
Transactions Volume
-
Price by trans
-
Price/ sq.ft. by trans. (S.A.)
-
Price by listing
$8.5M
-$9.9M
Price sq.ft. by listing
$12,319
-$15,231
/sq.ft.Buy2
Rent/ sq.ft. by trans. (S.A.) inMar
-
Rent Volume
-
Rent Price by trans
-
Rent/ sq.ft. by trans. (S.A.)
-
Rent by listing
-
Rent sq.ft. by listing
-
Wing Lee Building
Estate Info
Estate Overview
Date of Occupation Permit
1963-12-1963-12
No. of Phases
-
No. of Blocks
1 Block(s)
Total units
89
Walking toTsim Sha TsuiStation
4 Min(s)
Address/ Area
33 KIMBERLEY ROAD
School Net
Property Management Company
-
Category
-
Developer
-
Other Facilities
-
Wing Lee Building
Location
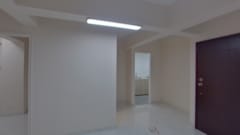

Wing Lee Building
Transaction
 Data currently unavailable
Transaction History
Floor/ Room
FLOOR 9
FLOOR 8
FLOOR 7
FLOOR 6
FLOOR 5
FLOOR 4
FLOOR 3
FLOOR 2
FLOOR 1
P/H
FLAT A
Saleable(sqft)
Gross(sqft)
Price
Year
Gain/Loss
0
0
-
-
-
957
0
$5.7M
2016
-
1158
1500
-
-
-
1158
0
-
-
-
1158
0
-
-
-
0
0
-
-
-
1158
1050
$7.9M
2010
82%
1158
0
$3.8M
2008
-
0
0
-
-
-
FLAT B
Saleable(sqft)
Gross(sqft)
Price
Year
Gain/Loss
0
1800
-
-
-
931
1500
-
-
-
931
0
$2.8M
1996
-
0
0
-
-
-
0
0
-
-
-
0
0
-
-
-
931
0
-
-
-
0
0
-
-
-
FLAT C
Saleable(sqft)
Gross(sqft)
Price
Year
Gain/Loss
643
850
$2.78M
2006
-
0
0
$5M
2024
-
643
0
$1.6M
2000
-
643
0
$4.8M
2016
-
643
520
$1.63M
2005
-
643
0
$6.44M
2015
-
643
600
$2.18M
2006
21%
0
0
$2.1M
2007
-
0
0
-
-
-
FLAT D
Saleable(sqft)
Gross(sqft)
Price
Year
Gain/Loss
690
750
$1M
2003
-
690
750
$1.39M
1996
-
0
0
-
-
-
690
900
-
-
-
0
0
-
-
-
0
0
-
-
-
690
645
$1.2M
2002
36%
690
0
$6.6M
2014
97%
690
0
-
-
-
0
0
-
-
-
FLAT E
Saleable(sqft)
Gross(sqft)
Price
Year
Gain/Loss
757
0
-
-
-
0
0
-
-
-
0
0
-
-
-
757
1100
$6.28M
2012
-
757
0
$1.57M
2004
-
757
0
$6.06M
2016
-
757
1000
$2.3M
1997
-
0
0
-
-
-
757
0
-
-
-
FLAT F
Saleable(sqft)
Gross(sqft)
Price
Year
Gain/Loss
0
0
-
-
-
757
0
-
-
-
757
805
$7.75M
2017
-
0
0
-
-
-
757
0
-
-
-
757
520
$1.35M
2002
-
757
690
$5.3M
2011
25%
757
0
-
-
-
757
0
$3.26M
2008
-
0
0
-
-
-
FLAT G
Saleable(sqft)
Gross(sqft)
Price
Year
Gain/Loss
690
0
-
-
-
0
0
-
-
-
0
0
-
-
-
0
770
-
-
-
0
0
-
-
-
690
0
-
-
-
690
0
$7M
2022
-
690
645
-
-
-
690
770
$1.2M
2004
-
FLAT H
Saleable(sqft)
Gross(sqft)
Price
Year
Gain/Loss
0
0
-
-
-
643
800
$2.05M
1998
-
643
0
-
-
-
0
0
-
-
-
0
0
-
-
-
643
0
$6M
2022
-
2736
0
$1.95M
2006
-
643
800
-
-
-
0
0
-
-
-
FLAT I
Saleable(sqft)
Gross(sqft)
Price
Year
Gain/Loss
833
0
-
-
-
833
0
$7.98M
2022
-
931
0
$7.3M
2016
-
931
0
$2.8M
1996
-
931
0
$7.8M
2013
47%
0
0
-
-
-
931
0
-
-
-
FLAT J
Saleable(sqft)
Gross(sqft)
Price
Year
Gain/Loss
961
0
$5.32M
2009
16%
961
845
$2.28M
1998
-
1158
0
-
-
-
1158
0
$16.18M
2019
-
0
0
-
-
-
1158
0
$9.8M
2017
-
1158
0
-
-
-
Relevant News
No Result Found