
King's Building
Price/ sq.ft. by trans. (S.A.) inMar
-
Transactions Volume
-
Price by trans
-
Price/ sq.ft. by trans. (S.A.)
-
Price by listing
$4.5M
-$5.58M
Price sq.ft. by listing
$14,331
-$17,771
/sq.ft.Buy2
Rent/ sq.ft. by trans. (S.A.) inMar
-
Rent Volume
-
Rent Price by trans
-
Rent/ sq.ft. by trans. (S.A.)
-
Rent by listing
-
Rent sq.ft. by listing
-


King's Building
Estate Info
Estate Overview
Date of Occupation Permit
1983-08-1983-08
No. of Phases
-
No. of Blocks
1 Block(s)
Total units
88
Walking toHKUStation
2 Min(s)
Address/ Area
521-525 QUEEN'S ROAD WEST
Property Management Company
-
Category
-
Developer
-
Other Facilities
-
King's Building
Location
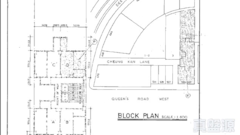

King's Building
Transaction
 Data currently unavailable
Transaction History
Floor/ Room
FLOOR 22
FLOOR 21
FLOOR 20
FLOOR 19
FLOOR 18
FLOOR 17
FLOOR 16
FLOOR 15
FLOOR 14
FLOOR 13
FLOOR 12
FLOOR 11
FLOOR 10
FLOOR 9
FLOOR 8
FLOOR 7
FLOOR 6
FLOOR 5
FLOOR 4
FLOOR 3
FLOOR 2
FLOOR 1
FLAT A
Saleable(sqft)
Gross(sqft)
Price
Year
Gain/Loss
344
435
$1.1M
2001
-
344
0
$5.63M
2022
50%
344
0
$923K
2004
-
344
460
$4.45M
2015
-
344
435
$5.65M
2018
53%
344
435
$3.33M
2012
-
344
435
$5.6M
2021
261%
344
435
-
-
-
344
435
-
-
-
344
435
$1.73M
2009
33%
344
0
$4.5M
2017
-
344
0
-
-
-
344
0
$4.5M
2023
-
344
460
$1.15M
2007
-
344
435
-
-
-
344
435
-
-
-
344
435
$738K
2004
-
344
435
-
-
-
344
435
-
-
-
344
435
$5.01M
2020
291%
344
435
-
-
-
344
435
$975K
2004
17%
FLAT B
Saleable(sqft)
Gross(sqft)
Price
Year
Gain/Loss
314
420
$5.85M
2019
105%
314
425
$5.7M
2022
133%
314
0
-
-
-
314
0
-
-
-
314
420
$4.1M
2015
38%
314
420
$1.67M
1997
24%
314
402
$4.43M
2017
78%
314
402
-
-
-
314
450
-
-
-
314
402
$1.64M
2008
31%
314
425
$880K
2001
55%
314
402
$1.3M
1996
-
314
402
-
-
-
314
402
-
-
-
314
402
-
-
-
314
402
-
-
-
314
402
-
-
-
314
402
$5.1M
2020
580%
314
402
-
-
-
314
402
-
-
-
314
402
-
-
-
314
402
$1.15M
1999
-
FLAT C
Saleable(sqft)
Gross(sqft)
Price
Year
Gain/Loss
344
435
$2.85M
2010
32%
344
435
-
-
-
344
435
-
-
-
344
450
$1.93M
2008
11%
344
0
$4.58M
2015
-
344
0
-
-
-
344
450
$1.23M
2000
31%
344
0
-
-
-
344
450
$1.1M
2005
47%
344
435
$1.81M
2009
-
344
435
$935K
2002
10%
344
0
-
-
-
344
450
$1.35M
1996
-
344
435
$1.63M
2009
27%
344
435
$1.75M
2008
-
344
435
$900K
2001
54%
344
435
$1.17M
2007
-
344
435
$1.5M
2000
11%
344
435
$2.62M
2011
-
344
435
$780K
2005
-
344
435
-
-
-
344
435
$5.9M
2018
231%
FLAT D
Saleable(sqft)
Gross(sqft)
Price
Year
Gain/Loss
314
402
$2.4M
2010
9%
314
0
$4.33M
2018
212%
314
0
-
-
-
314
405
$3.95M
2017
98%
314
405
$2.78M
2012
-
314
405
$1.95M
2010
6%
314
405
-
-
-
314
405
$1.4M
2009
-
314
0
-
-
-
314
0
-
-
-
314
0
-
-
-
314
420
$3.6M
2014
118%
314
405
$5.1M
2021
29%
314
420
$1.12M
2000
29%
314
402
$1.05M
2006
35%
314
402
$5.58M
2019
124%
314
400
$1.06M
1998
13%
314
0
-
-
-
314
0
-
-
-
314
0
-
-
-
314
0
$1.64M
1997
-
314
420
$4.48M
2017
2%
Relevant News
No Result Found