
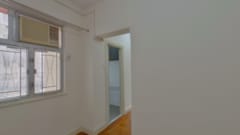
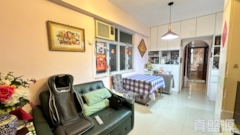
Win Fong Heights
Price/ sq.ft. by trans. (S.A.) inMar
$9,349/sq.ft.
Transactions Volume
1Record(s)
Price by trans
$4.45M
-$4.45M
Price/ sq.ft. by trans. (S.A.)
$9,349
-$9,349
/sq.ft.Price by listing
$4.08M
-$5M
Price sq.ft. by listing
$10,787
-$10,893
/sq.ft.Buy3
Rent/ sq.ft. by trans. (S.A.) inMar
-
Rent Volume
-
Rent Price by trans
-
Rent/ sq.ft. by trans. (S.A.)
-
Rent by listing
-
Rent sq.ft. by listing
-


Win Fong Heights
Estate Info
Estate Overview
Date of Occupation Permit
1977-03-1977-03
No. of Phases
-
No. of Blocks
1 Block(s)
Total units
151
Walking toKwai FongStation
5 Min(s)
Address/ Area
180 HING FONG ROAD
School Net
Property Management Company
-
Category
-
Developer
-
Other Facilities
-
Win Fong Heights
Location
Win Fong Heights
Recommendation

WIN FONG HEIGHTS2Rooms
Saleable
375sq.ft.
$
4.08 M
WIN FONG HEIGHTS2Rooms
Saleable
375sq.ft.
$
4.08 M

WIN FONG HEIGHTS3Rooms2Living Room(s)
Saleable
445sq.ft.
$
4.8 M
WIN FONG HEIGHTS3Rooms2Living Room(s)
Saleable
445sq.ft.
$
4.8 M
WIN FONG HEIGHTS3Rooms
Saleable
459sq.ft.
Gross
638sq.ft.
$
5 M
WIN FONG HEIGHTS3Rooms
Saleable
459sq.ft.
Gross
638sq.ft.
$
5 M
Win Fong Heights
Transaction
 Data currently unavailable
Transaction History
Floor/ Room
FLOOR 21
FLOOR 20
FLOOR 19
FLOOR 18
FLOOR 17
FLOOR 16
FLOOR 15
FLOOR 14
FLOOR 13
FLOOR 12
FLOOR 11
FLOOR 10
FLOOR 9
FLOOR 8
FLOOR 7
FLOOR 6
FLOOR 5
FLOOR 4
FLOOR 3
FLAT A
Saleable(sqft)
Gross(sqft)
Price
Year
Gain/Loss
375
0
$4.95M
2021
-
375
0
$4.78M
2018
84%
375
0
$568K
2003
53%
0
0
-
-
-
375
520
$638K
2003
-
375
520
$2.04M
2012
5%
0
0
-
-
-
0
0
-
-
-
0
0
-
-
-
0
0
-
-
-
375
0
$2.12M
2011
52%
375
490
$1.13M
1999
-
0
0
-
-
-
0
0
-
-
-
375
0
-
-
-
0
0
-
-
-
0
0
$1.1M
2007
15%
375
0
$2.15M
2012
25%
375
0
$1.88M
1997
81%
FLAT B
Saleable(sqft)
Gross(sqft)
Price
Year
Gain/Loss
0
0
-
-
-
375
500
$600K
2002
-
375
0
$4.9M
2021
26%
375
0
$1.45M
2009
20%
375
0
$3.68M
2023
-
375
550
$3.5M
2020
40%
0
520
-
-
-
375
0
$1.28M
2010
49%
375
520
$4.8M
2021
24%
0
0
-
-
-
375
479
$1.8M
2010
29%
0
0
-
-
-
375
550
-
-
-
0
550
-
-
-
0
500
-
-
-
375
0
$4.28M
2023
-
375
0
$4.15M
2023
27%
0
0
-
-
-
375
0
$1.71M
1997
-
FLAT C
Saleable(sqft)
Gross(sqft)
Price
Year
Gain/Loss
459
680
$2.57M
2011
12%
0
0
-
-
-
0
0
-
-
-
459
0
$2.3M
2012
-
0
620
-
-
-
459
620
$1.75M
1998
-
459
0
$5.68M
2018
54%
0
0
-
-
-
459
0
$6.04M
2019
472%
459
620
$800K
1999
-
0
0
-
-
-
0
0
-
-
-
0
0
-
-
-
0
0
-
-
-
459
0
$2.9M
2021
-
459
620
-
-
-
459
620
$4.37M
2022
-
0
0
-
-
-
459
0
-
-
-
FLAT D
Saleable(sqft)
Gross(sqft)
Price
Year
Gain/Loss
476
0
-
-
-
0
0
-
-
-
476
0
-
-
-
476
0
$4.22M
2016
-
0
0
-
-
-
0
0
-
-
-
476
580
$900K
2002
8%
476
600
$1.08M
2006
39%
476
620
$2.39M
2012
181%
0
0
-
-
-
476
0
$898K
2001
-
476
580
$1.03M
2006
23%
476
0
$5.3M
2021
-
476
0
$4.5M
2023
-
0
0
-
-
-
476
0
$4.2M
2017
-
0
0
-
-
-
476
0
$4.38M
2021
22%
476
0
$4.9M
2016
34%
FLAT E
Saleable(sqft)
Gross(sqft)
Price
Year
Gain/Loss
446
620
$4M
2016
-
446
625
$2.3M
2011
236%
446
610
$900K
2002
-
0
620
-
-
-
446
0
$5.15M
2022
-
0
0
-
-
-
446
620
-
-
-
446
0
$5.7M
2018
217%
0
0
-
-
-
0
0
-
-
-
446
610
-
-
-
446
0
$3.43M
2014
48%
446
620
$1.5M
1996
-
446
620
-
-
-
0
0
-
-
-
446
0
$4.28M
2015
-
0
620
-
-
-
446
620
$720K
1996
-
446
0
$3.44M
2014
39%
FLAT F
Saleable(sqft)
Gross(sqft)
Price
Year
Gain/Loss
446
620
$6.18M
2021
390%
0
0
-
-
-
446
0
-
-
-
446
0
$4.28M
2015
-
446
0
$2M
2015
-
0
750
-
-
-
446
0
$5.35M
2020
435%
446
0
$5.54M
2020
20%
446
620
-
-
-
446
0
$830K
2003
-
0
0
-
-
-
0
0
-
-
-
446
600
$2.69M
2012
18%
446
0
$5M
2022
-
446
600
$1.9M
2010
-
446
600
$1.16M
2000
-
0
620
-
-
-
446
620
$1.26M
2008
100%
FLAT G
Saleable(sqft)
Gross(sqft)
Price
Year
Gain/Loss
476
0
-
-
-
0
0
-
-
-
476
0
$4.15M
2016
-
0
0
-
-
-
476
571
$2.85M
2012
117%
0
0
-
-
-
476
620
$4.5M
2017
14%
0
0
-
-
-
0
0
$4.45M
2024
-
476
620
$1.48M
1998
-
476
0
$5.52M
2021
15%
0
0
-
-
-
0
0
-
-
-
0
0
-
-
-
0
620
-
-
-
0
0
-
-
-
0
0
-
-
-
476
0
-
-
-
476
620
$6.49M
2021
354%
Relevant News
No Result Found