
Yee King Court
Price/ sq.ft. by trans. (S.A.) inMar
-
Transactions Volume
-
Price by trans
-
Price/ sq.ft. by trans. (S.A.)
-
Price by listing
$4.8M
-$5.3M
Price sq.ft. by listing
$16,382
-$18,089
/sq.ft.Buy2
Rent/ sq.ft. by trans. (S.A.) inMar
-
Rent Volume
-
Rent Price by trans
-
Rent/ sq.ft. by trans. (S.A.)
-
Rent by listing
-
Rent sq.ft. by listing
-


Yee King Court
Estate Info
Estate Overview
Date of Occupation Permit
1998-02-1998-02
No. of Phases
-
No. of Blocks
1 Block(s)
Total units
78
Walking toCheung Sha WanStation
10 Min(s)
Address/ Area
513-521 SHUN NING ROAD
School Net
Property Management Company
-
Category
-
Developer
-
Other Facilities
-
Yee King Court
Location
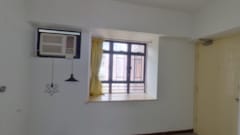

Yee King Court
Transaction
 Data currently unavailable
Transaction History
Floor/ Room
FLOOR 35
FLOOR 33
FLOOR 32
FLOOR 31
FLOOR 30
FLOOR 29
FLOOR 28
FLOOR 27
FLOOR 26
FLOOR 25
FLOOR 23
FLOOR 22
FLOOR 21
FLOOR 20
FLOOR 19
FLOOR 18
FLOOR 17
FLOOR 16
FLOOR 15
FLOOR 13
FLOOR 12
FLOOR 11
FLOOR 10
FLOOR 9
FLOOR 8
FLOOR 7
FLOOR 3
FLOOR 2
FLAT A
Saleable(sqft)
Gross(sqft)
Price
Year
Gain/Loss
293
446
$2.12M
2010
25%
293
446
$3.22M
2014
39%
293
446
$2.3M
2012
10%
293
446
$1.75M
2010
59%
293
446
$4.45M
2017
82%
0
446
$2.57M
1997
-
293
446
$5.2M
2020
69%
293
446
$2.2M
2011
88%
293
446
$5.38M
2018
197%
293
446
$4M
2024
53%
293
438
$4.55M
2018
87%
293
438
$1.75M
2011
5%
0
438
$2.19M
1998
6%
293
438
$5.19M
2020
333%
293
438
$1.52M
2009
52%
293
438
$1.29M
2009
25%
293
438
$4.74M
2023
108%
293
438
$1.49M
2009
16%
293
438
$4.38M
2023
114%
0
438
$1.97M
1997
-
293
438
$1.35M
2007
38%
293
438
$5.17M
2018
199%
293
438
$5.13M
2018
51%
293
438
$5.18M
2022
28%
293
438
$2.38M
2012
71%
293
438
$925K
2004
-
FLAT B
Saleable(sqft)
Gross(sqft)
Price
Year
Gain/Loss
380
572
$6M
2018
58%
0
572
$1.36M
2004
56%
380
572
$2.3M
2010
35%
380
572
$4.5M
2017
55%
380
572
$2M
2010
36%
380
572
$2.3M
2010
31%
380
572
$5M
2017
72%
380
572
$3.55M
2013
133%
380
572
$6M
2020
74%
0
572
$2.6M
1998
11%
0
572
$2.17M
1997
-
380
572
$5.51M
2018
14%
380
572
$1.55M
2008
43%
0
572
$2.93M
1997
-
380
572
$2.78M
2011
83%
380
572
$5.98M
2020
119%
0
572
$1.35M
2005
50%
0
572
$3.1M
1997
-
380
572
$2.8M
1997
-
0
572
$2.47M
1997
-
380
558
$1.15M
2004
58%
0
558
$1.33M
2001
45%
0
558
$2.65M
1997
-
380
558
$5.8M
2020
199%
380
558
$3.3M
2014
-
380
558
$2.51M
1997
-
FLAT C
Saleable(sqft)
Gross(sqft)
Price
Year
Gain/Loss
404
592
$1.72M
2000
48%
404
592
$6.8M
2022
109%
404
592
$2.72M
2010
67%
404
592
$1.88M
2009
3%
404
600
$6.45M
2023
38%
0
600
$3.53M
1997
-
0
600
$3.5M
1997
-
0
600
-
-
-
404
600
$4.7M
2017
180%
404
600
$2.8M
2011
3%
404
592
$2.95M
2011
-
0
592
-
-
-
404
592
$2.45M
2010
8%
0
592
$1.55M
2004
40%
404
592
$1.64M
2006
29%
0
592
$1.6M
2006
46%
404
592
$3.27M
2012
20%
0
592
$2.3M
1999
36%
0
592
-
-
-
404
592
$1.78M
2009
33%
404
592
$6.22M
2022
199%
404
592
$2.7M
2011
74%
404
592
$5.78M
2023
54%
0
592
$2.18M
1999
11%
404
592
$3.06M
1997
-
404
592
$1.73M
2009
54%
Relevant News
No Result Found