
Winfield Gardens
Price/ sq.ft. by trans. (S.A.) inMar
-
Transactions Volume
-
Price by trans
-
Price/ sq.ft. by trans. (S.A.)
-
Price by listing
$19.3M
-$23M
Price sq.ft. by listing
$16,510
-$19,675
/sq.ft.Buy3
Rent/ sq.ft. by trans. (S.A.) inMar
-
Rent Volume
-
Rent Price by trans
-
Rent/ sq.ft. by trans. (S.A.)
-
Rent by listing
-
Rent sq.ft. by listing
-
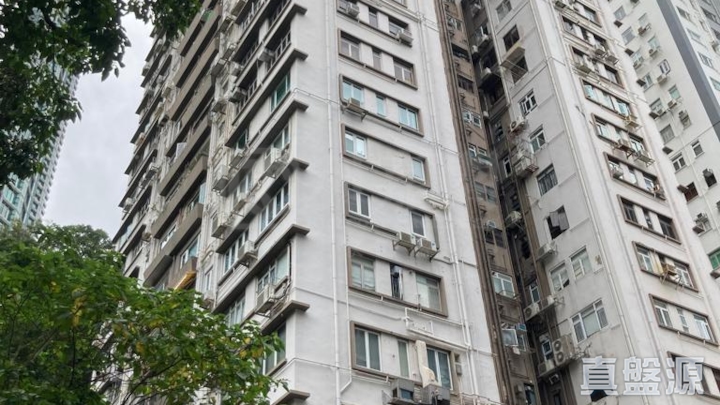
Winfield Gardens
Estate Info
Estate Overview
Date of Occupation Permit
1966-11-1966-11
No. of Phases
-
No. of Blocks
1 Block(s)
Total units
74
Walking To MTR Station
-
Address/ Area
34-40 SHAN KWONG ROAD
School Net
Property Management Company
-
Category
-
Developer
-
Other Facilities
-
Winfield Gardens
Location
Winfield Gardens
Recommendation
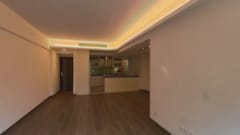

WINFIELD GARDENS3Rooms2Living Room(s)
Saleable
1,169sq.ft.
Gross
1,500sq.ft.
$
23 M
WINFIELD GARDENS3Rooms2Living Room(s)
Saleable
1,169sq.ft.
Gross
1,500sq.ft.
$
23 M
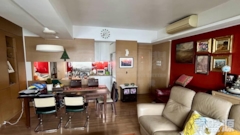
WINFIELD GARDENS3Rooms2Living Room(s)
Saleable
1,124sq.ft.
Gross
1,500sq.ft.
$
19.5 M
WINFIELD GARDENS3Rooms2Living Room(s)
Saleable
1,124sq.ft.
Gross
1,500sq.ft.
$
19.5 M
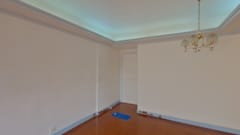
WINFIELD GARDENS3Rooms2Living Room(s)
Saleable
1,169sq.ft.
Gross
1,500sq.ft.
$
19.3 M
WINFIELD GARDENS3Rooms2Living Room(s)
Saleable
1,169sq.ft.
Gross
1,500sq.ft.
$
19.3 M
Winfield Gardens
Transaction
 Data currently unavailable
Transaction History
Floor/ Room
FLOOR 19
FLOOR 18
FLOOR 17
FLOOR 16
FLOOR 15
FLOOR 14
FLOOR 13
FLOOR 12
FLOOR 11
FLOOR 10
FLOOR 9
FLOOR 8
FLOOR 7
FLOOR 6
FLOOR 5
FLOOR 4
FLOOR 3
FLOOR 2
FLOOR 1
U/G
L/G
FLAT A (NO. 36)
Saleable(sqft)
Gross(sqft)
Price
Year
Gain/Loss
1105
1500
-
-
-
1169
1500
-
-
-
1169
1500
-
-
-
1169
1500
-
-
-
1169
1500
$7.38M
2006
76%
0
1500
-
-
-
0
1500
-
-
-
0
1500
-
-
-
0
1500
-
-
-
1169
1500
$20.87M
2015
41%
1169
1500
$13.6M
2009
6%
1169
1500
$9.2M
1997
-
1169
1500
$21.68M
2018
-
1169
1500
$19.1M
2021
-
1169
1500
-
-
-
1169
1500
$20.5M
2021
8%
1169
1500
$19.6M
2020
400%
1169
1500
$9M
2007
49%
1169
1500
-
-
-
FLAT B (NO. 40)
Saleable(sqft)
Gross(sqft)
Price
Year
Gain/Loss
1124
1110
-
-
-
1169
1500
-
-
-
1169
1500
-
-
-
1169
1500
$20.8M
2023
395%
0
1500
$16.8M
2023
-
1169
1500
-
-
-
1169
1500
-
-
-
1169
1500
-
-
-
1169
1500
-
-
-
1169
1127
-
-
-
1169
1500
$22.5M
2019
-
1169
1500
$4M
2004
-
1169
1127
$9.25M
2009
-
1169
1500
$18.63M
2021
203%
1169
1500
$6.3M
1998
-
0
1500
-
-
-
1169
1500
-
-
-
1169
1500
$12M
2011
-
FLAT C (NO. 34)
Saleable(sqft)
Gross(sqft)
Price
Year
Gain/Loss
2229
0
-
-
-
1169
1500
$21M
2021
163%
1169
1500
$21.5M
2022
-
1169
1127
$19M
2020
-
1169
1500
$21M
2017
25%
1169
1500
$21M
2017
-
0
1500
-
-
-
0
1500
-
-
-
1169
1500
-
-
-
1169
1500
$4.9M
1999
-
0
1500
-
-
-
1169
1500
$5.2M
2000
-
1169
1500
-
-
-
1169
1500
$18.53M
2014
-
1169
1500
$5.45M
1999
-
1169
1500
$16.2M
2012
-
1169
1500
-
-
-
1169
1500
$9.41M
2009
139%
FLAT D (NO. 38)
Saleable(sqft)
Gross(sqft)
Price
Year
Gain/Loss
2211
1500
-
-
-
1124
1500
$10.8M
2009
198%
1169
1500
$5.6M
1999
-
1169
1500
-
-
-
1169
1500
$8.9M
2007
-
1169
1500
-
-
-
1169
1500
$9.3M
2009
3%
0
1500
-
-
-
0
1500
-
-
-
0
1500
-
-
-
1169
1500
$8.18M
2007
109%
1169
1500
$5.08M
1996
-
1169
1127
-
-
-
1169
1500
$21.6M
2019
188%
1169
1500
$20M
2020
90%
1169
1500
$21M
2011
379%
1169
1500
$3.38M
2001
-
1169
1500
$10M
2008
-
1169
1500
$18.5M
2018
-
Relevant News
No Result Found