
Skyview Cliff
Price/ sq.ft. by trans. (S.A.) inMar
$16,621/sq.ft.
Transactions Volume
1Record(s)
Price by trans
$13.38M
-$13.38M
Price/ sq.ft. by trans. (S.A.)
$16,621
-$16,621
/sq.ft.Price by listing
$16M
-$17.8M
Price sq.ft. by listing
$19,876
-$21,090
/sq.ft.Buy3
Rent/ sq.ft. by trans. (S.A.) inMar
-
Rent Volume
-
Rent Price by trans
-
Rent/ sq.ft. by trans. (S.A.)
-
Rent by listing
-
Rent sq.ft. by listing
-


Skyview Cliff
Estate Info
Estate Overview
Date of Occupation Permit
1995-05-1995-05
No. of Phases
-
No. of Blocks
1 Block(s)
Total units
96
Walking toSai Ying PunStation
11 Min(s)
Address/ Area
49 CONDUIT ROAD
Property Management Company
-
Category
-
Developer
CHINACHEM GROUP/SUN HUNG KAI
Other Facilities
Swimming Pool
Skyview Cliff
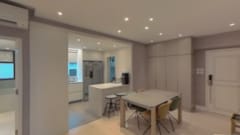
Location
Skyview Cliff
Recommendation

SKYVIEW CLIFF2Rooms
Saleable
805sq.ft.
Gross
1,006sq.ft.
$
16.3 M
SKYVIEW CLIFF2Rooms
Saleable
805sq.ft.
Gross
1,006sq.ft.
$
16.3 M
SKYVIEW CLIFF3Rooms
Saleable
844sq.ft.
Gross
1,074sq.ft.
$
17.8 M
SKYVIEW CLIFF3Rooms
Saleable
844sq.ft.
Gross
1,074sq.ft.
$
17.8 M

SKYVIEW CLIFF3Rooms
Saleable
805sq.ft.
Gross
1,006sq.ft.
$
16 M
SKYVIEW CLIFF3Rooms
Saleable
805sq.ft.
Gross
1,006sq.ft.
$
16 M
Skyview Cliff
Transaction
 Data currently unavailable
Transaction History
Floor/ Room
FLOOR 24
FLOOR 23
FLOOR 22
FLOOR 21
FLOOR 20
FLOOR 19
FLOOR 18
FLOOR 17
FLOOR 16
FLOOR 15
FLOOR 14
FLOOR 13
FLOOR 12
FLOOR 11
FLOOR 10
FLOOR 9
FLOOR 8
FLOOR 7
FLOOR 6
FLOOR 5
FLOOR 4
FLOOR 3
FLOOR 2
FLOOR 1
FLOOR G
FLAT A
Saleable(sqft)
Gross(sqft)
Price
Year
Gain/Loss
805
1006
$6.35M
2006
-
805
1006
$18.3M
2018
79%
805
1006
$8.58M
1996
-
805
1006
$6.73M
2006
6%
805
1006
$7.02M
1996
-
805
1006
$17.21M
2019
64%
805
1006
$7.79M
1996
-
805
1006
$5.3M
1998
21%
805
1006
$7.99M
1997
21%
805
1006
$16.8M
2019
65%
805
1006
$12.93M
2013
23%
805
1006
$12.9M
2013
104%
805
1006
$6.24M
1996
-
805
1006
$7.5M
1998
10%
805
1006
$5.3M
2005
1%
805
1006
$6.05M
2005
24%
805
1006
$6.85M
2009
16%
805
1006
$12M
2012
123%
805
1006
$6.06M
1996
-
805
1006
$13.77M
2013
197%
805
1006
$7.7M
2008
47%
805
1006
$5.58M
2006
10%
805
1006
$7M
2010
74%
746
935
$3.69M
1999
-
FLAT B
Saleable(sqft)
Gross(sqft)
Price
Year
Gain/Loss
844
1074
$18.4M
2019
40%
883
1113
$17M
2021
108%
883
1113
$16.28M
2022
80%
883
1113
$8.6M
1996
8%
883
1113
$7.4M
2005
42%
883
1113
$10.7M
1997
21%
883
1113
$14.2M
2016
49%
883
1113
$6.73M
2007
35%
883
1113
$11.48M
2011
30%
883
1113
$6.04M
2006
18%
883
1113
$17M
2022
106%
883
1113
$13.78M
2014
94%
883
1113
$15.78M
2022
181%
883
1113
$7.66M
1996
-
883
1113
$7.19M
1996
-
883
1113
$17.8M
2021
178%
883
1113
$6.7M
2007
5%
883
1113
$7.88M
2007
8%
883
1113
$16.6M
2020
-
883
1113
$11.36M
2011
57%
883
1113
$13.08M
2022
35%
883
1113
$5.65M
2006
30%
883
1113
$15.1M
2022
53%
622
778
$5.55M
2008
16%
FLAT C
Saleable(sqft)
Gross(sqft)
Price
Year
Gain/Loss
844
1074
$10.25M
2010
61%
883
1113
$6.29M
2004
-
883
1113
$13.9M
2013
101%
883
1113
$16.2M
2019
10%
883
1113
$5.16M
2001
-
883
1113
$6.39M
2009
14%
883
1113
$10.5M
2010
23%
883
1113
$8M
2009
36%
883
1113
$8.5M
2008
-
883
1113
$5M
2004
-
883
1113
$12.45M
2012
98%
883
1113
$4.9M
2000
52%
883
1113
$16M
2018
191%
883
1113
$4.6M
2001
-
883
1113
$13.2M
2024
15%
883
1113
$9.55M
1997
12%
883
1113
$6.46M
1996
-
883
1113
$17M
2018
13%
883
1113
$13.6M
2022
42%
883
1113
$13M
2014
107%
883
1113
$4.8M
2004
-
883
1113
$13.8M
2017
63%
883
1113
$4.8M
2004
-
855
1076
$4.22M
2001
-
FLAT D
Saleable(sqft)
Gross(sqft)
Price
Year
Gain/Loss
805
1006
$9.4M
2010
9%
805
1006
$13.38M
2024
53%
805
1006
$9.38M
2010
60%
805
1006
$4.3M
1998
38%
805
1006
$9.1M
2010
46%
805
1006
$4.52M
2002
-
805
1006
$8.15M
2009
16%
805
1006
$9.15M
1997
45%
805
1006
$6.22M
1996
-
805
1006
$10.48M
2011
48%
805
1006
$11.5M
2016
21%
805
1006
$3.48M
2003
42%
805
1006
$5.9M
1996
-
805
1006
$12M
2014
50%
805
1006
$14.8M
2018
127%
805
1006
$5.68M
1996
-
805
1006
$5.34M
1999
37%
805
1006
$9.6M
2012
19%
805
1006
$12M
2019
172%
773
1006
$4.2M
2000
34%
805
1006
$12.08M
2016
25%
805
1006
$13.68M
2018
168%
805
1006
$11.6M
2016
97%
646
851
$10.8M
2019
112%
Relevant News
No Result Found