
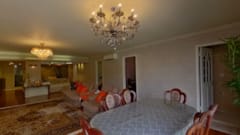
Aegean Terrace
Price/ sq.ft. by trans. (S.A.) inMar
-
Transactions Volume
-
Price by trans
-
Price/ sq.ft. by trans. (S.A.)
-
Price by listing
$27.18M
-$36M
Price sq.ft. by listing
$18,414
-$22,444
/sq.ft.Buy2
Rent/ sq.ft. by trans. (S.A.) inMar
-
Rent Volume
-
Rent Price by trans
-
Rent/ sq.ft. by trans. (S.A.)
-
Rent by listing
-
Rent sq.ft. by listing
-
Aegean Terrace
Estate Info
Estate Overview
Date of Occupation Permit
1990-09-1990-09
No. of Phases
-
No. of Blocks
1 Block(s)
Total units
28
Walking To MTR Station
-
Address/ Area
60 SASSOON ROAD
School Net
Property Management Company
-
Category
-
Developer
-
Other Facilities
-
Aegean Terrace
Location

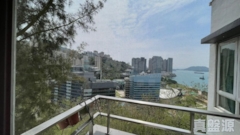
Aegean Terrace
Transaction
 Data currently unavailable
Transaction History
Floor/ Room
FLOOR 2
FLOOR 1
STEP 1
FLOOR G
FLAT G
Saleable(sqft)
Gross(sqft)
Price
Year
Gain/Loss
1626
2064
$10.5M
1999
-
1626
2064
$13.3M
2006
5%
1626
2064
$9.48M
1999
-
FLAT I
Saleable(sqft)
Gross(sqft)
Price
Year
Gain/Loss
1530
1936
$12.2M
2004
1%
1465
1860
$8.8M
2004
-
1423
1802
$8.8M
2000
-
Relevant News
No Result Found