
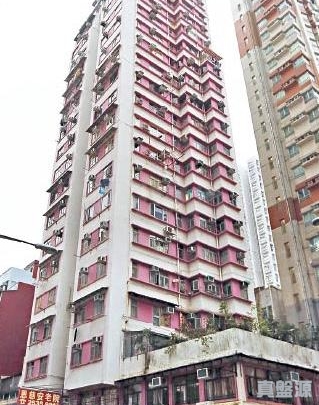
Cheung Hing Building
Price/ sq.ft. by trans. (S.A.) inMar
-
Transactions Volume
-
Price by trans
-
Price/ sq.ft. by trans. (S.A.)
-
Price by listing
-
Price sq.ft. by listing
-
Rent/ sq.ft. by trans. (S.A.) inMar
-
Rent Volume
-
Rent Price by trans
-
Rent/ sq.ft. by trans. (S.A.)
-
Rent by listing
-
Rent sq.ft. by listing
-
Cheung Hing Building
Estate Info
Estate Overview
Date of Occupation Permit
1973-12-1973-12
No. of Phases
-
No. of Blocks
1 Block(s)
Total units
80
Walking toSai Wan HoStation
1 Min(s)
Address/ Area
110-110A SAI WAN HO STREET
School Net
Property Management Company
-
Category
-
Developer
-
Other Facilities
-
Cheung Hing Building
Location
Cheung Hing Building
Recommendation
 No Result Found
Cheung Hing Building
Transaction
Data currently unavailableTransaction History
Floor/ Room
FLOOR 20
FLOOR 19
FLOOR 18
FLOOR 17
FLOOR 16
FLOOR 15
FLOOR 14
FLOOR 13
FLOOR 12
FLOOR 11
FLOOR 10
FLOOR 9
FLOOR 8
FLOOR 7
FLOOR 6
FLOOR 5
FLOOR 4
FLOOR 3
FLOOR 2
FLOOR 1
FLAT A
Saleable(sqft)
Gross(sqft)
Price
Year
Gain/Loss
220
380
$3.38M
2020
1%
259
0
-
-
-
299
0
$920K
2005
130%
318
0
-
-
-
344
0
$4.2M
2023
-
344
0
-
-
-
344
0
$4.45M
2017
-
344
0
-
-
-
344
0
$4M
2022
25%
344
400
$1.4M
2007
27%
344
0
$2.38M
2012
183%
344
0
-
-
-
344
0
-
-
-
344
0
$4.7M
2019
-
344
0
$4.45M
2020
40%
344
0
$1.27M
1995
-
344
0
$3.8M
2023
-
344
0
$1.5M
2014
20%
344
0
-
-
-
0
0
-
-
-
FLAT B
Saleable(sqft)
Gross(sqft)
Price
Year
Gain/Loss
220
0
$600K
1998
-
259
0
-
-
-
299
428
$1.68M
1997
12%
318
428
-
-
-
344
428
$920K
2000
-
344
428
-
-
-
344
428
-
-
-
344
428
-
-
-
344
428
-
-
-
344
428
$5.28M
2020
-
344
428
-
-
-
344
428
-
-
-
344
428
$3.2M
2015
-
344
428
$1.74M
2008
9%
344
423
$1.73M
2008
73%
344
0
-
-
-
344
450
-
-
-
344
0
-
-
-
344
428
$450K
2003
-
0
0
$5.2M
2017
-
FLAT C
Saleable(sqft)
Gross(sqft)
Price
Year
Gain/Loss
291
520
$2.7M
2012
35%
291
0
-
-
-
291
428
$1.27M
1996
-
307
0
-
-
-
307
0
$1.88M
2010
15%
307
0
-
-
-
307
0
-
-
-
339
0
$2.98M
2023
46%
339
0
-
-
-
339
0
$1M
1998
-
339
0
$2M
2012
141%
339
0
-
-
-
339
0
-
-
-
339
520
$4.03M
2017
295%
339
520
$633K
2002
-
339
520
-
-
-
339
520
$4.3M
2017
583%
339
0
-
-
-
339
0
$3.9M
2016
-
0
0
-
-
-
FLAT D
Saleable(sqft)
Gross(sqft)
Price
Year
Gain/Loss
291
0
-
-
-
291
420
$4.25M
2021
335%
291
420
$1.36M
1995
-
307
420
$4.18M
2018
-
307
420
$3.1M
2013
-
307
420
$3.1M
2013
77%
307
430
$4.45M
2020
389%
339
0
$3.6M
2015
-
339
0
$550K
1997
-
339
0
-
-
-
339
0
$3.75M
2023
26%
339
0
$1.8M
2011
253%
339
0
-
-
-
339
450
$1.81M
2010
10%
339
428
$680K
2001
35%
339
0
$5.17M
2019
-
339
0
-
-
-
339
0
-
-
-
339
420
$460K
2003
-
0
0
-
-
-
Relevant News
No Result Found