
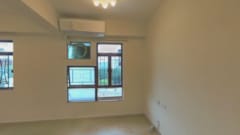
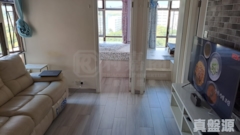
San Fung Building
Price/ sq.ft. by trans. (S.A.) inMar
-
Transactions Volume
-
Price by trans
-
Price/ sq.ft. by trans. (S.A.)
-
Price by listing
$4.08M
-$4.71M
Price sq.ft. by listing
$11,895
-$12,015
/sq.ft.Buy2
Rent/ sq.ft. by trans. (S.A.) inMar
-
Rent Volume
-
Rent Price by trans
-
Rent/ sq.ft. by trans. (S.A.)
-
Rent by listing
-
Rent sq.ft. by listing
-


San Fung Building
Estate Info
Estate Overview
Date of Occupation Permit
1993-10-1993-10
No. of Phases
-
No. of Blocks
1 Block(s)
Total units
72
Walking toSheung ShuiStation
9 Min(s)
Address/ Area
33 SAN FUNG AVENUE
School Net
Property Management Company
-
Category
-
Developer
-
Other Facilities
-
San Fung Building
Location
San Fung Building
Recommendation

San Fung Building
Transaction
 Data currently unavailable
Transaction History
Floor/ Room
FLOOR 20
FLOOR 19
FLOOR 18
FLOOR 17
FLOOR 16
FLOOR 15
FLOOR 14
FLOOR 13
FLOOR 12
FLOOR 11
FLOOR 10
FLOOR 9
FLOOR 8
FLOOR 7
FLOOR 6
FLOOR 5
FLOOR 4
FLOOR 3
B/M
FLAT A
Saleable(sqft)
Gross(sqft)
Price
Year
Gain/Loss
343
471
$1.75M
2010
-
0
471
-
-
-
0
471
-
-
-
343
471
$2.45M
2013
-
343
471
$1.78M
2011
123%
0
471
-
-
-
343
471
$3.02M
2016
-
343
471
$1M
2004
-
343
471
$3.38M
2015
245%
343
471
$2.95M
2016
173%
343
471
$3.38M
2015
238%
0
471
-
-
-
343
471
$1.8M
2011
13%
343
471
$1.34M
1995
-
0
471
-
-
-
0
471
-
-
-
343
471
$1.63M
1997
-
343
471
-
-
-
FLAT B
Saleable(sqft)
Gross(sqft)
Price
Year
Gain/Loss
392
536
$3.7M
2016
85%
392
536
$4.68M
2021
186%
0
536
-
-
-
392
536
-
-
-
0
536
-
-
-
0
536
$1.62M
1996
-
392
536
$2.03M
2011
-
392
536
$1.2M
2008
29%
392
536
$1.8M
2010
100%
392
536
$3M
2015
-
0
536
-
-
-
0
536
$1.48M
1996
-
0
536
-
-
-
392
536
$3.3M
2014
206%
392
536
$2.96M
2016
-
0
536
-
-
-
392
536
$3.8M
2017
171%
392
536
$2.8M
2016
-
FLAT C
Saleable(sqft)
Gross(sqft)
Price
Year
Gain/Loss
392
536
-
-
-
392
536
$1.42M
2000
20%
392
536
$1.84M
1996
-
0
536
-
-
-
392
536
$2.78M
2012
54%
0
536
-
-
-
392
536
$4.63M
2020
20%
0
536
$1.63M
1996
-
0
536
-
-
-
392
536
$3.3M
2015
49%
392
536
$3.6M
2016
-
392
536
$4.58M
2019
244%
0
536
-
-
-
0
536
-
-
-
392
536
$1.78M
1997
-
392
536
$1.48M
1995
-
392
536
-
-
-
392
536
$1.49M
1996
-
FLAT D
Saleable(sqft)
Gross(sqft)
Price
Year
Gain/Loss
343
471
-
-
-
343
471
$4.52M
2020
53%
0
471
$1.85M
1997
-
0
471
-
-
-
343
471
$880K
2002
49%
343
471
$1.99M
2012
44%
343
471
$3.84M
2018
284%
343
418
$1.05M
2007
16%
343
471
$1.2M
2009
50%
343
471
$3.49M
2017
47%
343
471
$2.55M
2013
-
0
471
$930K
2005
10%
343
471
$2.38M
2013
18%
0
471
$1.04M
2007
37%
0
471
$1M
2007
17%
343
471
-
-
-
343
471
$1.12M
2009
16%
343
471
-
-
-
Relevant News
No Result Found