
Foo Yet Kai Building
Price/ sq.ft. by trans. (S.A.) inMar
-
Transactions Volume
-
Price by trans
-
Price/ sq.ft. by trans. (S.A.)
-
Price by listing
$6M
-$6.8M
Price sq.ft. by listing
$15,957
-$18,994
/sq.ft.Buy3
Rent/ sq.ft. by trans. (S.A.) inMar
-
Rent Volume
-
Rent Price by trans
-
Rent/ sq.ft. by trans. (S.A.)
-
Rent by listing
-
Rent sq.ft. by listing
-


Foo Yet Kai Building
Estate Info
Estate Overview
Date of Occupation Permit
1980-05-1980-05
No. of Phases
-
No. of Blocks
1 Block(s)
Total units
126
Walking toNorth PointStation
4 Min(s)
Address/ Area
52-60A JAVA ROAD
School Net
Property Management Company
-
Category
-
Developer
-
Other Facilities
-
Foo Yet Kai Building
Location
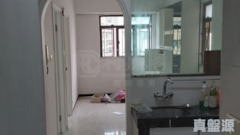
Foo Yet Kai Building
Recommendation
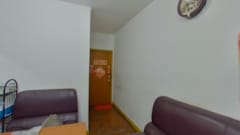

FOO YET KAI BUILDING2Rooms1Living Room(s)
Saleable
376sq.ft.
Gross
443sq.ft.
$
6 M
FOO YET KAI BUILDING2Rooms1Living Room(s)
Saleable
376sq.ft.
Gross
443sq.ft.
$
6 M
FOO YET KAI BUILDING2Rooms1Living Room(s)
Saleable
358sq.ft.
Gross
429sq.ft.
$
6.8 M
FOO YET KAI BUILDING2Rooms1Living Room(s)
Saleable
358sq.ft.
Gross
429sq.ft.
$
6.8 M

FOO YET KAI BUILDING2Rooms1Living Room(s)
Saleable
356sq.ft.
Gross
430sq.ft.
$
6 M
FOO YET KAI BUILDING2Rooms1Living Room(s)
Saleable
356sq.ft.
Gross
430sq.ft.
$
6 M
Foo Yet Kai Building
Transaction
 Data currently unavailable
Transaction History
Floor/ Room
FLOOR 23
FLOOR 22
FLOOR 21
FLOOR 20
FLOOR 19
FLOOR 18
FLOOR 17
FLOOR 16
FLOOR 15
FLOOR 14
FLOOR 13
FLOOR 12
FLOOR 11
FLOOR 10
FLOOR 9
FLOOR 8
FLOOR 7
FLOOR 6
FLOOR 5
FLOOR 4
FLOOR 3
FLAT A
Saleable(sqft)
Gross(sqft)
Price
Year
Gain/Loss
360
430
-
-
-
356
430
-
-
-
356
430
-
-
-
356
430
-
-
-
356
430
-
-
-
356
430
$2.98M
2012
-
356
430
-
-
-
356
430
$3M
2012
89%
356
430
-
-
-
356
430
-
-
-
356
430
$1.43M
2000
29%
356
430
-
-
-
356
430
$2.47M
1997
-
356
430
$1.7M
1995
-
356
430
-
-
-
356
430
$1.63M
1996
-
356
430
-
-
-
356
430
$4.8M
2023
177%
356
430
$2.35M
2010
50%
356
430
-
-
-
356
430
-
-
-
FLAT B
Saleable(sqft)
Gross(sqft)
Price
Year
Gain/Loss
358
429
-
-
-
358
429
-
-
-
358
429
-
-
-
358
429
-
-
-
358
429
-
-
-
358
429
$2.98M
2012
-
358
429
-
-
-
358
429
$1.43M
1998
-
358
429
-
-
-
358
429
$4M
2014
-
358
429
-
-
-
358
429
-
-
-
358
429
$4M
2016
-
358
429
-
-
-
358
429
$1.57M
1996
-
358
429
$1.16M
2004
16%
358
429
$2M
2010
43%
0
429
-
-
-
0
429
-
-
-
0
429
$1.62M
1996
-
358
429
$3.6M
2011
105%
FLAT C
Saleable(sqft)
Gross(sqft)
Price
Year
Gain/Loss
358
429
-
-
-
358
429
-
-
-
358
429
-
-
-
358
429
-
-
-
358
429
-
-
-
358
429
$2.98M
2012
-
358
429
-
-
-
358
429
$2.8M
2011
60%
358
429
-
-
-
358
429
-
-
-
358
429
-
-
-
358
429
-
-
-
358
429
$1.57M
2009
-
358
429
-
-
-
358
429
-
-
-
358
429
-
-
-
358
429
$920K
2001
-
358
429
$3.23M
2012
74%
358
429
-
-
-
358
429
-
-
-
358
429
$1.3M
2001
-
FLAT D
Saleable(sqft)
Gross(sqft)
Price
Year
Gain/Loss
356
430
-
-
-
356
430
-
-
-
356
430
-
-
-
356
430
-
-
-
356
430
-
-
-
356
430
$2.98M
2012
-
356
430
-
-
-
356
430
$1.7M
2008
-
356
430
$6.1M
2020
307%
356
430
-
-
-
356
430
$6.08M
2021
52%
356
430
$1.53M
2007
10%
356
430
$4.46M
2016
313%
356
430
$1.08M
2001
59%
356
430
-
-
-
356
430
$5.8M
2019
-
356
430
$1.56M
2007
-
356
430
$1.56M
2008
16%
356
430
-
-
-
356
430
-
-
-
358
430
-
-
-
Relevant News
No Result Found