
Chee King Garden
Price/ sq.ft. by trans. (S.A.) inMar
-
Transactions Volume
-
Price by trans
-
Price/ sq.ft. by trans. (S.A.)
-
Price by listing
$4.4M
-$6.6M
Price sq.ft. by listing
$10,424
-$12,500
/sq.ft.Buy3
Rent/ sq.ft. by trans. (S.A.) inMar
-
Rent Volume
-
Rent Price by trans
-
Rent/ sq.ft. by trans. (S.A.)
-
Rent by listing
$10,800
-$17,000
Rent sq.ft. by listing
$27
-$31
/sq.ft.Rent3


Chee King Garden
Estate Info
Estate Overview
Date of Occupation Permit
1986-07-1986-07
No. of Phases
-
No. of Blocks
1 Block(s)
Total units
76
Walking toYuen LongStation
11 Min(s)
Address/ Area
45 KIN TAK STREET
School Net
Property Management Company
-
Category
-
Developer
-
Other Facilities
-
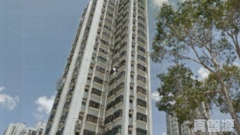
Chee King Garden
Location
Chee King Garden
Recommendation
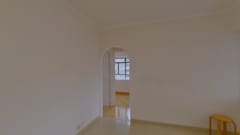

CHEE KING GARDEN3Rooms1Living Room(s)
Saleable
566sq.ft.
Gross
911sq.ft.
$
5.9 M
CHEE KING GARDEN3Rooms1Living Room(s)
Saleable
566sq.ft.
Gross
911sq.ft.
$
5.9 M

CHEE KING GARDEN2Rooms
Saleable
352sq.ft.
Gross
578sq.ft.
$
4.4 M
CHEE KING GARDEN2Rooms
Saleable
352sq.ft.
Gross
578sq.ft.
$
4.4 M
CHEE KING GARDEN3Rooms2Living Room(s)
Saleable
566sq.ft.
Gross
911sq.ft.
$
6.6 M
CHEE KING GARDEN3Rooms2Living Room(s)
Saleable
566sq.ft.
Gross
911sq.ft.
$
6.6 M
Chee King Garden
Transaction
 Data currently unavailable
Transaction History
Floor/ Room
FLOOR 20
FLOOR 19
FLOOR 18
FLOOR 17
FLOOR 16
FLOOR 15
FLOOR 14
FLOOR 13
FLOOR 12
FLOOR 11
FLOOR 10
FLOOR 9
FLOOR 8
FLOOR 7
FLOOR 6
FLOOR 5
FLOOR 4
FLOOR 3
FLOOR 2
FLAT A
Saleable(sqft)
Gross(sqft)
Price
Year
Gain/Loss
566
911
-
-
-
566
911
$3.02M
2012
69%
566
911
-
-
-
566
911
-
-
-
566
911
$6.97M
2021
287%
0
911
-
-
-
0
911
-
-
-
566
911
$6.28M
2019
35%
566
911
$6.5M
2020
83%
566
911
$2.95M
2012
-
0
911
$1.13M
2004
-
0
911
-
-
-
0
911
-
-
-
566
911
$1.13M
2002
-
0
911
$1.11M
2002
-
0
911
$1.6M
1996
-
0
911
-
-
-
566
911
$2.88M
2012
38%
566
911
$1.35M
2006
36%
FLAT B
Saleable(sqft)
Gross(sqft)
Price
Year
Gain/Loss
566
911
-
-
-
566
911
$5.5M
2020
108%
0
911
$1.67M
1998
-
566
911
$1.72M
2008
8%
0
911
-
-
-
0
911
$2.48M
1997
-
0
911
-
-
-
0
911
$1.8M
1996
-
0
911
-
-
-
0
911
-
-
-
566
911
$2.98M
2012
66%
0
911
$1.75M
1995
-
566
911
$3.8M
2015
-
0
911
-
-
-
0
911
-
-
-
566
911
-
-
-
566
911
$3M
1997
-
0
911
-
-
-
566
911
$1.18M
2004
-
FLAT C
Saleable(sqft)
Gross(sqft)
Price
Year
Gain/Loss
352
578
$4.45M
2019
65%
0
578
$1.02M
2007
2%
352
578
$1.98M
2011
34%
0
578
$1.22M
1996
-
352
578
$4.8M
2021
7%
0
578
-
-
-
352
578
$1.04M
2009
5%
0
578
$1.1M
2007
5%
352
578
$725K
2005
37%
0
578
-
-
-
0
578
-
-
-
0
578
-
-
-
352
578
$2.33M
2012
103%
352
578
-
-
-
0
578
-
-
-
352
578
$1.5M
2010
-
352
578
-
-
-
352
578
$1.61M
2010
25%
352
578
-
-
-
Relevant News
No Result Found