
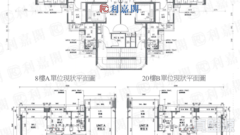
The Austine Place
Price/ sq.ft. by trans. (S.A.) inMar
$18,161/sq.ft.
Transactions Volume
1Record(s)
Price by trans
$15.8M
-$15.8M
Price/ sq.ft. by trans. (S.A.)
$18,161
-$18,161
/sq.ft.Price by listing
$17M
-$22.8M
Price sq.ft. by listing
$19,518
-$26,177
/sq.ft.Buy7
Rent/ sq.ft. by trans. (S.A.) inMar
-
Rent Volume
-
Rent Price by trans
-
Rent/ sq.ft. by trans. (S.A.)
-
Rent by listing
-
Rent sq.ft. by listing
-
The Austine Place
Estate Info
Estate Overview
Date of Occupation Permit
2014-09-2014-09
No. of Phases
-
No. of Blocks
1 Block(s)
Total units
42
Walking toJordanStation
3 Min(s)
Address/ Area
38 KWUN CHUNG STREET
School Net
Property Management Company
興勝物業服務有限公司
Category
-
Developer
HANISON CONSTRUCTION/SMART SOLAR
Other Facilities
-
The Austine Place
Location
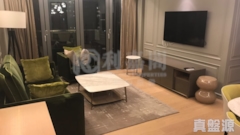
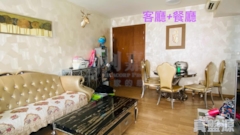
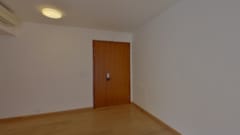
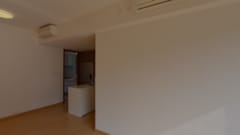
The Austine Place
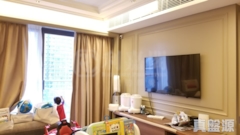
Recommendation
THE AUSTINE PLACE2Rooms2Living Room(s)
Saleable
870sq.ft.
$
19 M
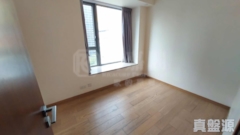
THE AUSTINE PLACE2Rooms2Living Room(s)
Saleable
870sq.ft.
$
19 M
THE AUSTINE PLACE2Rooms2Living Room(s)
Saleable
871sq.ft.
$
17 M
THE AUSTINE PLACE2Rooms2Living Room(s)
Saleable
871sq.ft.
$
17 M

THE AUSTINE PLACE2Rooms
Saleable
870sq.ft.
$
22 M
THE AUSTINE PLACE2Rooms
Saleable
870sq.ft.
$
22 M
THE AUSTINE PLACE2Rooms2Living Room(s)
Saleable
871sq.ft.
$
22.8 M
THE AUSTINE PLACE2Rooms2Living Room(s)
Saleable
871sq.ft.
$
22.8 M
THE AUSTINE PLACE2Rooms2Living Room(s)
Saleable
870sq.ft.
$
20.5 M
THE AUSTINE PLACE2Rooms2Living Room(s)
Saleable
870sq.ft.
$
20.5 M
THE AUSTINE PLACE2Rooms
Saleable
870sq.ft.
$
22 M
THE AUSTINE PLACE2Rooms
Saleable
870sq.ft.
$
22 M
THE AUSTINE PLACE2Rooms
Saleable
871sq.ft.
$
17 M
THE AUSTINE PLACE2Rooms
Saleable
871sq.ft.
$
17 M
The Austine Place
Transaction
 Data currently unavailable
Transaction History
Floor/ Room
FLOOR 27
FLOOR 26
FLOOR 25
FLOOR 23
FLOOR 22
FLOOR 21
FLOOR 20
FLOOR 19
FLOOR 18
FLOOR 17
FLOOR 16
FLOOR 15
FLOOR 12
FLOOR 11
FLOOR 10
FLOOR 9
FLOOR 8
FLOOR 7
FLOOR 6
FLOOR 5
FLOOR 3
FLAT A
Saleable(sqft)
Gross(sqft)
Price
Year
Gain/Loss
874
0
$34.68M
2015
-
871
0
$29M
2016
-
871
0
$27M
2017
-
0
0
$23.52M
2015
-
871
0
$22.9M
2015
-
0
0
$22.28M
2015
-
871
0
$24.36M
2015
-
871
0
$21.56M
2016
-
0
0
$20.17M
2015
-
871
0
$19.97M
2015
-
871
0
$20.63M
2015
-
871
0
$20.54M
2015
-
871
0
$18.46M
2014
-
871
0
$17.84M
2015
-
871
0
$17.75M
2015
-
871
0
$17.66M
2015
-
871
0
$19.57M
2015
-
871
0
$17.63M
2015
-
871
0
$15.5M
2018
2%
871
0
$17.57M
2015
-
871
0
$24.36M
2015
-
FLAT B
Saleable(sqft)
Gross(sqft)
Price
Year
Gain/Loss
874
0
$36.37M
2015
-
870
0
$29M
2016
-
870
0
$27M
2017
-
870
0
$24.36M
2015
-
870
0
$24.67M
2016
-
870
0
$23.93M
2016
-
870
0
$14M
2023
45%
870
0
$21.14M
2016
-
870
0
$20.24M
2015
-
870
0
$15.8M
2024
16%
870
0
$18.75M
2016
-
870
0
$18.67M
2016
-
870
0
$18.64M
2014
-
870
0
$18.02M
2014
-
870
0
$17.93M
2015
-
870
0
$17.84M
2015
-
870
0
$19.37M
2015
-
870
0
$17.81M
2015
-
870
0
$17.15M
2016
-
870
0
$18.48M
2016
-
870
0
$22.19M
2016
-
Relevant News
No Result Found