
1 Tai Hang Road
Price/ sq.ft. by trans. (S.A.) inMar
-
Transactions Volume
-
Price by trans
-
Price/ sq.ft. by trans. (S.A.)
-
Price by listing
$9.2M
-$13M
Price sq.ft. by listing
$16,458
-$23,256
/sq.ft.Buy6
Rent/ sq.ft. by trans. (S.A.) inMar
-
Rent Volume
-
Rent Price by trans
-
Rent/ sq.ft. by trans. (S.A.)
-
Rent by listing
-
Rent sq.ft. by listing
-
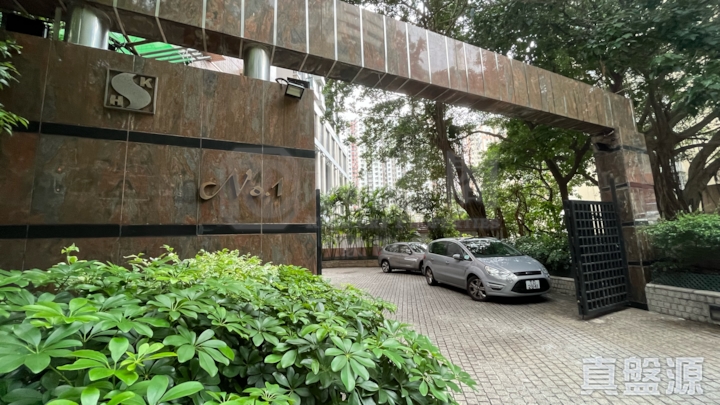
1 Tai Hang Road
Estate Info
Estate Overview
Date of Occupation Permit
1990-10-1990-10
No. of Phases
-
No. of Blocks
1 Block(s)
Total units
104
Walking toTin HauStation
9 Min(s)
Address/ Area
1 TAI HANG ROAD
School Net
Property Management Company
-
Category
-
Developer
-
Other Facilities
Swimming Pool, Children Playground/Play Room
1 Tai Hang Road
Location
1 Tai Hang Road
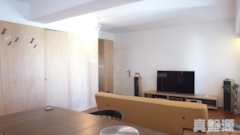
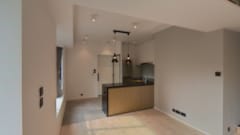
Recommendation
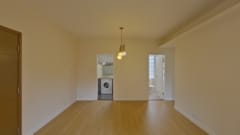

1 TAI HANG ROAD2Rooms2Living Room(s)
Saleable
575sq.ft.
Gross
738sq.ft.
$
11.88 M
1 TAI HANG ROAD2Rooms2Living Room(s)
Saleable
575sq.ft.
Gross
738sq.ft.
$
11.88 M

1 TAI HANG ROAD2Rooms1Living Room(s)
Saleable
559sq.ft.
Gross
715sq.ft.
$
10 M
1 TAI HANG ROAD2Rooms1Living Room(s)
Saleable
559sq.ft.
Gross
715sq.ft.
$
10 M

1 TAI HANG ROAD2Rooms1Living Room(s)
Saleable
559sq.ft.
Gross
711sq.ft.
$
13 M
1 TAI HANG ROAD2Rooms1Living Room(s)
Saleable
559sq.ft.
Gross
711sq.ft.
$
13 M

1 TAI HANG ROAD1Rooms1Living Room(s)
Saleable
559sq.ft.
Gross
711sq.ft.
$
11.6 M
1 TAI HANG ROAD1Rooms1Living Room(s)
Saleable
559sq.ft.
Gross
711sq.ft.
$
11.6 M
1 TAI HANG ROAD1Rooms2Living Room(s)
Saleable
559sq.ft.
Gross
711sq.ft.
$
9.2 M
1 TAI HANG ROAD1Rooms2Living Room(s)
Saleable
559sq.ft.
Gross
711sq.ft.
$
9.2 M
1 TAI HANG ROAD1Rooms1Living Room(s)
Saleable
575sq.ft.
Gross
738sq.ft.
$
10 M
1 TAI HANG ROAD1Rooms1Living Room(s)
Saleable
575sq.ft.
Gross
738sq.ft.
$
10 M
1 Tai Hang Road
Transaction
 Data currently unavailable
Transaction History
Floor/ Room
FLOOR 26
FLOOR 25
FLOOR 24
FLOOR 23
FLOOR 22
FLOOR 21
FLOOR 20
FLOOR 19
FLOOR 18
FLOOR 17
FLOOR 16
FLOOR 15
FLOOR 14
FLOOR 13
FLOOR 12
FLOOR 11
FLOOR 10
FLOOR 9
FLOOR 8
FLOOR 7
FLOOR 6
FLOOR 5
FLOOR 4
FLOOR 3
FLOOR 2
FLOOR 1
FLAT A
Saleable(sqft)
Gross(sqft)
Price
Year
Gain/Loss
872
1085
$12M
2010
7%
872
1085
$11.3M
1997
18%
872
1085
$16.9M
2015
91%
872
1085
$16.68M
2023
16%
872
1085
$20.6M
2021
65%
872
1085
$19.68M
2020
-
872
1085
$14.98M
2016
44%
872
1085
-
-
-
872
1085
$11.5M
2010
3%
872
1085
$18.5M
2019
137%
872
1085
-
-
-
872
1085
$5.9M
1999
-
872
1085
$16.38M
2021
-
872
1085
-
-
-
0
1085
-
-
-
872
1085
$13M
2011
30%
872
1085
$16.68M
2018
28%
872
1085
$6.38M
1998
33%
872
1085
$6M
2000
47%
872
1085
$12.5M
2012
-
872
1085
$8.55M
2010
10%
872
1085
$5.5M
2004
-
872
1085
$13.5M
2015
96%
872
1085
$13.8M
2019
-
872
1085
-
-
-
872
1085
$15.18M
2019
146%
FLAT B
Saleable(sqft)
Gross(sqft)
Price
Year
Gain/Loss
559
711
-
-
-
559
711
-
-
-
559
711
$12.8M
2020
58%
559
711
$7.13M
2010
16%
0
711
-
-
-
559
711
$12.2M
2018
22%
559
711
$10M
2020
92%
559
711
$11.88M
2018
108%
559
711
$7.2M
2010
1%
559
711
$12.6M
2019
47%
559
711
$10.5M
2016
51%
559
711
$8.38M
1997
52%
559
711
$11.53M
2020
22%
559
711
$6.93M
2010
47%
559
711
$6.38M
2010
58%
559
711
-
-
-
559
711
$11.5M
2020
109%
559
711
-
-
-
559
711
-
-
-
559
711
-
-
-
559
711
$10.2M
2018
65%
559
711
$8.2M
2014
-
559
711
$8.5M
2014
63%
559
711
$4.85M
1998
6%
559
711
$6.3M
2010
15%
559
711
$9.97M
2019
143%
FLAT C
Saleable(sqft)
Gross(sqft)
Price
Year
Gain/Loss
575
738
$8.45M
2010
60%
575
738
$6.03M
2007
37%
575
738
$4.88M
2006
3%
575
738
$6M
2009
28%
0
738
$5.2M
1996
-
575
738
$6M
2008
67%
575
738
$10.9M
2014
92%
575
738
$5.66M
2009
-
0
738
-
-
-
575
738
$13.2M
2019
123%
575
738
$12.8M
2020
25%
0
738
$4.56M
1996
-
0
738
-
-
-
575
738
-
-
-
0
738
-
-
-
575
738
-
-
-
575
738
$7.4M
1997
10%
575
738
$11.63M
2020
-
575
738
$2.92M
2002
-
575
738
$10M
2020
-
575
738
$4.98M
2007
-
575
738
$12.3M
2019
175%
575
738
$10.2M
2022
11%
584
743
$4.8M
2005
41%
584
743
$10M
2021
7%
584
743
-
-
-
FLAT D
Saleable(sqft)
Gross(sqft)
Price
Year
Gain/Loss
559
715
$5.1M
1996
-
0
715
-
-
-
0
715
-
-
-
559
715
$6.1M
2009
22%
559
715
$9.98M
2019
-
559
715
$5.03M
2006
28%
0
715
-
-
-
559
715
$12M
2019
111%
559
715
$10.1M
2017
94%
0
715
$4.4M
2004
19%
559
715
$10.5M
2017
33%
559
715
$11M
2023
56%
559
715
$10.8M
2019
58%
559
715
$9.5M
2018
7%
559
715
$7.8M
2010
31%
559
715
$4.05M
1999
24%
559
715
$4M
2004
-
559
715
$10M
2020
64%
559
715
-
-
-
0
715
-
-
-
0
715
-
-
-
559
715
$8M
2020
48%
0
715
$7M
1997
-
559
715
-
-
-
559
715
-
-
-
559
715
$3.57M
2005
-
Relevant News
No Result Found