
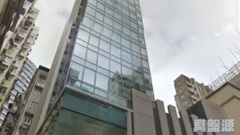
The Paseo
Price/ sq.ft. by trans. (S.A.) inMar
-
Transactions Volume
-
Price by trans
-
Price/ sq.ft. by trans. (S.A.)
-
Price by listing
$4.4M
-$6.5M
Price sq.ft. by listing
$20,952
-$29,545
/sq.ft.Buy5
Rent/ sq.ft. by trans. (S.A.) inMar
$61/sq.ft.
Rent Volume
2Record(s)
Rent Price by trans
$13,000
-$14,000
Rent/ sq.ft. by trans. (S.A.)
$59
-$63
/sq.ft.Rent by listing
$15,000
-$15,000
Rent sq.ft. by listing
$68
-$68
/sq.ft.Rent1
The Paseo
Estate Info
Estate Overview
Date of Occupation Permit
2016-03-2016-03
No. of Phases
-
No. of Blocks
1 Block(s)
Total units
66
Walking toAustinStation
4 Min(s)
Address/ Area
7 KWUN CHUNG STREET
School Net
Property Management Company
第一太平戴維斯物業管理有限公司
Category
-
Developer
RYKADAN CAPITAL
Other Facilities
-
The Paseo
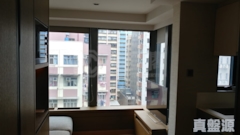
Location
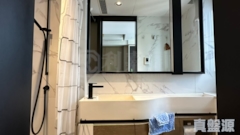
The Paseo
Recommendation
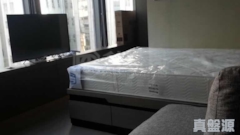
THE PASEO
Saleable
220sq.ft.
$
5 M
THE PASEO
Saleable
220sq.ft.
$
5 M
THE PASEO1Living Room(s)
Saleable
210sq.ft.
$
4.4 M
THE PASEO1Living Room(s)
Saleable
210sq.ft.
$
4.4 M
THE PASEO1Living Room(s)
Saleable
210sq.ft.
$
5.5 M
THE PASEO1Living Room(s)
Saleable
210sq.ft.
$
5.5 M
THE PASEO
Saleable
220sq.ft.
$
6 M
THE PASEO
Saleable
220sq.ft.
$
6 M

THE PASEO
Saleable
220sq.ft.
$
6.5 M
THE PASEO
Saleable
220sq.ft.
$
6.5 M
The Paseo
Transaction
 Data currently unavailable
Transaction History
Floor/ Room
FLOOR 28
FLOOR 27
FLOOR 26
FLOOR 25
FLOOR 23
FLOOR 22
FLOOR 21
FLOOR 20
FLOOR 19
FLOOR 18
FLOOR 17
FLOOR 16
FLOOR 15
FLOOR 12
FLOOR 11
FLOOR 10
FLOOR 9
FLOOR 8
FLOOR 7
FLOOR 6
FLOOR 5
FLOOR 3
FLAT A
Saleable(sqft)
Gross(sqft)
Price
Year
Gain/Loss
220
0
$6.55M
2015
-
220
0
$6.1M
2015
-
220
0
$6.37M
2015
-
220
0
$5.74M
2015
-
220
0
$5.95M
2015
-
220
0
$5.1M
2021
17%
220
0
$5.72M
2015
-
220
0
$4.78M
2020
20%
220
0
$6M
2015
-
220
0
$5.63M
2016
-
220
0
$5.42M
2015
-
220
0
$5.54M
2015
-
220
0
$5.34M
2015
-
220
0
$5.35M
2015
-
220
0
$5.29M
2015
-
220
0
$5.27M
2015
-
220
0
$5.12M
2015
-
220
0
$5.03M
2015
-
220
0
$5.03M
2015
-
220
0
$15.44M
2015
-
220
0
$4.8M
2015
-
220
0
$4.68M
2015
-
FLAT B
Saleable(sqft)
Gross(sqft)
Price
Year
Gain/Loss
210
0
$5.97M
2015
-
210
0
$5.44M
2015
-
210
0
$5.4M
2015
-
210
0
$5.2M
2019
9%
210
0
$5.38M
2015
-
210
0
$5.46M
2015
-
210
0
$5.3M
2015
-
210
0
$5.44M
2015
-
210
0
$5.28M
2015
-
210
0
$5.36M
2016
-
210
0
$5.2M
2015
-
210
0
$5.16M
2015
-
210
0
$5.23M
2016
-
210
0
-
-
-
210
0
$5.48M
2015
-
210
0
$5.33M
2015
-
210
0
$5.34M
2015
-
210
0
$5.14M
2015
-
210
0
$4M
2021
16%
210
0
$4.75M
2015
-
210
0
$5.08M
2017
-
210
0
$4.79M
2015
-
FLAT C
Saleable(sqft)
Gross(sqft)
Price
Year
Gain/Loss
222
0
$4.1M
2023
32%
222
0
$6.29M
2015
-
222
0
$5.91M
2015
-
222
0
$5.84M
2015
-
222
0
$5.89M
2015
-
222
0
$6.17M
2015
-
222
0
$5.72M
2015
-
222
0
$5.89M
2015
-
222
0
$6.08M
2015
-
222
0
$5.85M
2015
-
222
0
$5.59M
2015
-
222
0
$5.56M
2015
-
222
0
$5.86M
2015
-
222
0
$5.57M
2015
-
222
0
$5.42M
2015
-
222
0
$4.7M
2021
12%
222
0
$5.36M
2016
-
222
0
-
-
-
222
0
$5.1M
2015
-
222
0
$4.96M
2015
-
222
0
$5.2M
2022
11%
222
0
$4.44M
2015
-
Relevant News
No Result Found