18 Upper East
Price/ sq.ft. by trans. (S.A.) inFeb
-
Transactions Volume
-
Price by trans
-
Price/ sq.ft. by trans. (S.A.)
-
Price by listing
$8.1M
-$9.8M
Price sq.ft. by listing
$16,023
-$20,417
/sq.ft.Buy6
Rent/ sq.ft. by trans. (S.A.) inFeb
-
Rent Volume
-
Rent Price by trans
-
Rent/ sq.ft. by trans. (S.A.)
-
Rent by listing
$22,000
-$26,000
Rent sq.ft. by listing
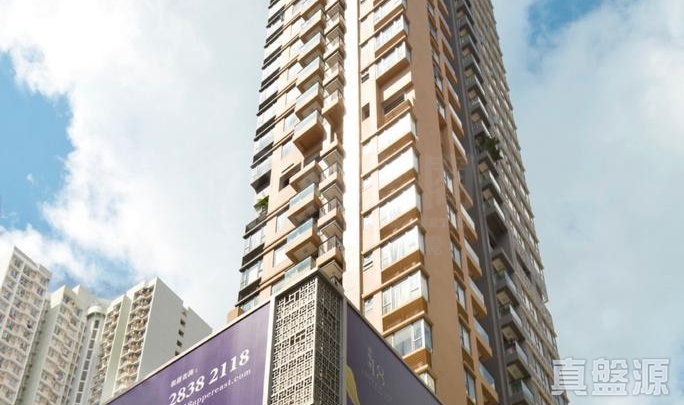
$46
-$54
/sq.ft.Rent2
18 Upper East
Estate Info
Estate Overview
Date of Occupation Permit
2012-07-2012-07
No. of Phases
-
No. of Blocks
1 Block(s)
Total units
108
Walking toSai Wan HoStation
2 Min(s)
Address/ Area
18 SHING ON STREET
School Net
Property Management Company
英皇物業管理(香港)有限公司
Category
Club
Developer
EMPEROR GROUP
Other Facilities
Gymnasium, Karaoke Room, Barbecue Area, Music Room, Computer Room, Judo/Yoga Room, Marjong
18 Upper East
Location
18 Upper East
Recommendation
No Result Found
18 Upper East
Transaction
Data currently unavailable
Transaction History
Floor/ Room
FLOOR 38
FLOOR 37
FLOOR 36
FLOOR 35
FLOOR 32
FLOOR 31
FLOOR 30
FLOOR 29
FLOOR 28
FLOOR 27
FLOOR 26
FLOOR 25
FLOOR 23
FLOOR 22
FLOOR 21
FLOOR 20
FLOOR 19
FLOOR 18
FLOOR 17
FLOOR 16
FLOOR 15
FLOOR 11
FLOOR 10
FLOOR 9
FLOOR 8
FLOOR 7
FLOOR 6
FLOOR 5
FLAT A
Saleable(sqft)
Gross(sqft)
Price
Year
Gain/Loss
968
1339
$27.8M
2015
-
917
1274
$20.52M
2015
-
917
1274
$24.9M
2015
-
746
1035
$16.29M
2011
-
475
659
$8.3M
2011
-
475
659
$8.1M
2011
-
475
659
$8.2M
2020
6%
475
659
$8.15M
2011
-
475
659
$7.8M
2012
-
475
659
$7.35M
2017
20%
475
659
$8.4M
2021
8%
475
659
$7.73M
2011
-
475
659
$7.6M
2011
-
475
659
$7.2M
2015
9%
475
659
$7.4M
2011
-
475
659
$7.41M
2011
-
475
659
$7.68M
2020
1%
475
659
$7.3M
2011
-
475
659
$7.08M
2011
-
475
659
$6.85M
2011
-
475
659
$7.24M
2011
-
475
659
$6.33M
2011
-
475
659
$6.68M
2011
-
475
659
$6.8M
2015
8%
475
659
$6.25M
2011
-
475
659
$6.7M
2011
-
475
659
$5.97M
2015
-
437
607
$9.85M
2016
-
FLAT B
Saleable(sqft)
Gross(sqft)
Price
Year
Gain/Loss
703
975
$14.2M
2015
-
518
720
$9.33M
2011
-
518
720
$8.8M
2018
7%
518
720
$7.8M
2015
-
518
720
$8.8M
2020
14%
518
720
$9.4M
2019
21%
518
720
$7.08M
2024
19%
518
720
$8.43M
2011
-
518
720
$9.32M
2019
10%
518
720
$7.6M
2015
8%
518
720
$6.93M
2024
1%
518
720
$8.7M
2018
12%
518
720
$7.89M
2011
-
518
720
$7.86M
2011
-
518
720
$8.8M
2018
19%
518
720
$7.6M
2011
-
518
720
$7.4M
2014
3%
518
720
$7.85M
2021
11%
518
720
$7.44M
2011
-
518
720
$7.27M
2011
-
518
720
$8.5M
2021
13%
518
720
$6M
2014
-
518
720
$6.91M
2011
-
518
720
$6.7M
2015
-
480
667
$8.78M
2015
-
FLAT C
Saleable(sqft)
Gross(sqft)
Price
Year
Gain/Loss
531
737
$8.5M
2018
12%
531
737
$9.62M
2011
-
531
737
$8.14M
2015
-
531
737
$9.47M
2011
-
531
737
$8.07M
2015
-
531
737
$9.31M
2011
-
531
737
$8M
2023
4%
531
737
$7.05M
2024
17%
531
737
$8.59M
2011
-
531
737
$9.55M
2021
12%
531
737
$8.3M
2019
1%
531
737
$8.37M
2011
-
531
737
$7.89M
2011
-
531
737
$8.3M
2019
2%
531
737
$9.45M
2021
10%
531
737
$8.33M
2018
8%
531
737
$8.12M
2017
10%
533
740
$8.98M
2019
22%
533
740
$8.95M
2021
15%
533
740
$7.4M
2015
6%
533
740
$7.8M
2015
7%
533
740
$6.79M
2011
-
533
740
$8.39M
2021
14%
511
711
$8.55M
2020
23%
FLAT D
Saleable(sqft)
Gross(sqft)
Price
Year
Gain/Loss
356
494
$7.33M
2021
23%
356
494
$7.25M
2021
22%
356
494
$5.88M
2015
-
356
494
$6.52M
2020
1%
356
494
$6.19M
2011
-
356
494
$6.26M
2011
-
356
494
$7.15M
2022
13%
356
494
$5.91M
2011
-
356
494
$5.9M
2011
-
356
494
$5.53M
2011
-
356
494
$5.86M
2011
-
356
494
$5.8M
2023
8%
356
494
$5.63M
2011
-
356
494
$6.5M
2018
16%
356
494
$5.54M
2011
-
356
494
$6.45M
2020
19%
318
441
$6.23M
2011
-
256
355
$5.1M
2020
24%
256
355
$4.11M
2011
-
256
355
$4.88M
2020
14%
256
355
$4.75M
2017
11%
256
355
$4.23M
2011
-
256
355
$4.75M
2020
7%
236
329
$4.43M
2015
-
FLAT E
Saleable(sqft)
Gross(sqft)
Price
Year
Gain/Loss
305
423
$4.26M
2011
-
305
423
$5.25M
2021
18%
305
423
$5.25M
2020
30%
305
423
$5.23M
2020
19%
305
423
$4.35M
2011
-
305
423
$5.3M
2015
18%
264
367
$4.4M
2022
9%
Relevant News
No Result Found