
King Kwong Mansion
Price/ sq.ft. by trans. (S.A.) inMar
-
Transactions Volume
-
Price by trans
-
Price/ sq.ft. by trans. (S.A.)
-
Price by listing
$4.88M
-$5.38M
Price sq.ft. by listing
$18,842
-$20,772
/sq.ft.Buy3
Rent/ sq.ft. by trans. (S.A.) inMar
-
Rent Volume
-
Rent Price by trans
-
Rent/ sq.ft. by trans. (S.A.)
-
Rent by listing
-
Rent sq.ft. by listing
-
King Kwong Mansion
Estate Info
Estate Overview
Date of Occupation Permit
1989-06-1989-06
No. of Phases
-
No. of Blocks
1 Block(s)
Total units
42
Walking toCauseway BayStation
16 Min(s)
Address/ Area
8 KING KWONG STREET
School Net
Property Management Company
-
Category
-
Developer
-
Other Facilities
-
King Kwong Mansion
Location
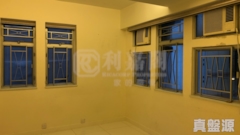
King Kwong Mansion
Recommendation
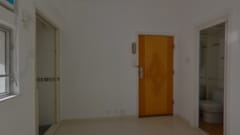

KING KWONG MANSION1Rooms1Living Room(s)
Saleable
259sq.ft.
Gross
401sq.ft.
$
5.38 M
KING KWONG MANSION1Rooms1Living Room(s)
Saleable
259sq.ft.
Gross
401sq.ft.
$
5.38 M

KING KWONG MANSION1Living Room(s)
Saleable
259sq.ft.
Gross
401sq.ft.
$
4.88 M
KING KWONG MANSION1Living Room(s)
Saleable
259sq.ft.
Gross
401sq.ft.
$
4.88 M
KING KWONG MANSION1Living Room(s)
Saleable
259sq.ft.
Gross
401sq.ft.
$
5.3 M
KING KWONG MANSION1Living Room(s)
Saleable
259sq.ft.
Gross
401sq.ft.
$
5.3 M
King Kwong Mansion
Transaction
 Data currently unavailable
Transaction History
Floor/ Room
FLOOR 22
FLOOR 21
FLOOR 20
FLOOR 19
FLOOR 18
FLOOR 17
FLOOR 16
FLOOR 15
FLOOR 14
FLOOR 13
FLOOR 12
FLOOR 11
FLOOR 10
FLOOR 9
FLOOR 8
FLOOR 7
FLOOR 6
FLOOR 5
FLOOR 4
FLOOR 3
FLOOR 2
FLAT A
Saleable(sqft)
Gross(sqft)
Price
Year
Gain/Loss
259
401
$4.03M
2011
37%
259
401
$5.6M
2021
24%
259
401
$5.5M
2019
112%
259
401
$880K
2003
54%
259
401
-
-
-
259
401
$1.53M
2006
-
259
401
$5.46M
2019
29%
259
401
-
-
-
259
401
$3.65M
2012
51%
259
401
$4.9M
2022
119%
259
401
$4.36M
2017
-
259
401
$1.25M
2005
-
259
401
$2.08M
2009
9%
259
401
$4.14M
2017
76%
259
401
$4.98M
2019
27%
259
401
$5.28M
2020
125%
259
401
$4.04M
2014
234%
259
401
$1.79M
2009
7%
259
401
$2.53M
2010
12%
259
401
$1.8M
2009
14%
259
401
$5.4M
2014
26%
FLAT B
Saleable(sqft)
Gross(sqft)
Price
Year
Gain/Loss
259
401
$5.25M
2015
75%
259
401
$2.88M
2010
24%
259
401
$4.28M
2014
-
259
401
$2.46M
2009
41%
259
401
$5.45M
2021
70%
259
401
$5.5M
2022
-
259
401
$2.83M
2010
25%
259
401
$3.2M
2011
32%
0
401
$1.47M
2006
20%
259
401
$4.35M
2017
78%
259
401
$2.37M
2010
14%
259
401
$5.28M
2019
212%
259
401
$1.75M
2008
14%
259
401
$2.2M
2010
13%
259
401
$4.17M
2017
99%
259
401
$5M
2018
40%
259
401
$3.3M
2012
38%
259
401
$4.52M
2022
16%
259
401
$3.5M
2013
47%
259
401
$1.26M
2005
25%
259
401
-
-
-
Relevant News
No Result Found