
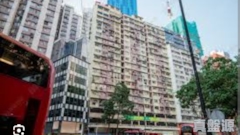
Yuet Ming Building
Price/ sq.ft. by trans. (S.A.) inMar
$10,143/sq.ft.
Transactions Volume
1Record(s)
Price by trans
$4.95M
-$4.95M
Price/ sq.ft. by trans. (S.A.)
$10,143
-$10,143
/sq.ft.Price by listing
$7.1M
-$7.99M
Price sq.ft. by listing
$11,252
-$12,866
/sq.ft.Buy3
Rent/ sq.ft. by trans. (S.A.) inMar
-
Rent Volume
-
Rent Price by trans
-
Rent/ sq.ft. by trans. (S.A.)
-
Rent by listing
-
Rent sq.ft. by listing
-


Yuet Ming Building
Estate Info
Estate Overview
Date of Occupation Permit
1966-06-1966-06
No. of Phases
-
No. of Blocks
1 Block(s)
Total units
200
Walking toFortress HillStation
3 Min(s)
Address/ Area
125-133 KING'S ROAD
School Net
Property Management Company
-
Category
-
Developer
-
Other Facilities
-
Yuet Ming Building
Location
Yuet Ming Building
Recommendation

YUET MING BUILDING2Rooms1Living Room(s)
Saleable
621sq.ft.
Gross
800sq.ft.
$
7.99 M
YUET MING BUILDING2Rooms1Living Room(s)
Saleable
621sq.ft.
Gross
800sq.ft.
$
7.99 M

YUET MING BUILDING2Rooms
Saleable
645sq.ft.
$
7.8 M
YUET MING BUILDING2Rooms
Saleable
645sq.ft.
$
7.8 M
YUET MING BUILDING3Rooms2Living Room(s)
Saleable
631sq.ft.
$
7.1 M
YUET MING BUILDING3Rooms2Living Room(s)
Saleable
631sq.ft.
$
7.1 M
Yuet Ming Building
Transaction
 Data currently unavailable
Transaction History
Floor/ Room
FLOOR 19
FLOOR 18
FLOOR 17
FLOOR 16
FLOOR 15
FLOOR 14
FLOOR 13
FLOOR 12
FLOOR 11
FLOOR 10
FLOOR 9
FLOOR 8
FLOOR 7
FLOOR 6
FLOOR 5
FLOOR 4
FLOOR 3
FLOOR 2
FLOOR 1
FLOOR M
FLAT A
Saleable(sqft)
Gross(sqft)
Price
Year
Gain/Loss
420
850
$4.45M
2014
-
621
850
-
-
-
621
850
$6.8M
2015
-
621
850
-
-
-
621
850
-
-
-
621
850
-
-
-
621
850
-
-
-
621
850
-
-
-
621
0
-
-
-
621
900
$4.31M
2012
-
621
0
-
-
-
621
850
$7.2M
2015
260%
621
0
-
-
-
621
0
-
-
-
621
0
$7.8M
2018
33%
621
0
-
-
-
621
630
-
-
-
FLAT B
Saleable(sqft)
Gross(sqft)
Price
Year
Gain/Loss
452
0
-
-
-
645
850
-
-
-
645
0
$6.48M
2014
-
645
0
-
-
-
645
0
$4.75M
2011
8%
645
0
-
-
-
645
0
-
-
-
645
0
-
-
-
645
0
-
-
-
645
0
-
-
-
645
865
$1.48M
2000
-
645
0
-
-
-
645
0
$8.08M
2020
106%
645
850
-
-
-
645
0
-
-
-
645
0
-
-
-
645
0
$3.79M
2010
-
FLAT C
Saleable(sqft)
Gross(sqft)
Price
Year
Gain/Loss
452
0
$2M
2008
16%
646
0
-
-
-
646
850
$2.04M
2006
21%
646
850
$5.5M
2013
-
646
0
-
-
-
646
0
-
-
-
646
0
-
-
-
646
0
-
-
-
646
0
-
-
-
646
0
-
-
-
0
0
$2.06M
2006
-
FLAT D
Saleable(sqft)
Gross(sqft)
Price
Year
Gain/Loss
452
865
$1.6M
2006
-
645
0
-
-
-
645
0
-
-
-
645
0
-
-
-
645
780
$8.35M
2021
16%
645
635
$1.35M
2001
-
645
780
$3.4M
2009
172%
645
0
-
-
-
645
0
$7.5M
2023
14%
645
0
-
-
-
0
0
$7M
2021
-
645
850
-
-
-
645
850
-
-
-
645
850
$4.53M
2010
42%
645
0
$7.85M
2022
31%
645
0
-
-
-
645
900
$1.12M
2003
-
FLAT E
Saleable(sqft)
Gross(sqft)
Price
Year
Gain/Loss
452
444
$900K
2004
-
645
0
-
-
-
645
0
$3.35M
1997
-
645
0
$2.89M
2007
44%
645
0
$7.18M
2016
-
645
0
-
-
-
645
0
-
-
-
645
850
$2.96M
1997
23%
645
850
$3M
2009
20%
645
850
-
-
-
645
850
$4.74M
2011
327%
645
850
-
-
-
645
0
$2.45M
1998
6%
645
0
-
-
-
645
0
-
-
-
645
0
-
-
-
645
0
-
-
-
FLAT F
Saleable(sqft)
Gross(sqft)
Price
Year
Gain/Loss
434
0
$1.75M
1997
-
645
0
-
-
-
645
850
$8M
2020
186%
645
850
$1.8M
2005
33%
645
850
$4.8M
2012
-
645
850
-
-
-
645
850
-
-
-
645
850
-
-
-
645
850
-
-
-
645
850
-
-
-
645
850
$9.8M
2019
56%
645
850
-
-
-
645
850
-
-
-
645
850
$4.18M
2010
-
645
900
-
-
-
645
850
$1.44M
1998
-
645
0
-
-
-
FLAT G
Saleable(sqft)
Gross(sqft)
Price
Year
Gain/Loss
636
900
$6M
2013
133%
636
0
-
-
-
636
0
-
-
-
636
0
-
-
-
636
0
$4.18M
2010
42%
636
0
$1.58M
2004
-
636
850
$8.1M
2021
162%
636
850
-
-
-
636
850
$1.6M
1997
-
636
850
-
-
-
636
850
$3M
2009
-
636
850
-
-
-
636
850
$8M
2022
326%
636
850
-
-
-
636
850
$1.47M
2004
-
636
0
$5.4M
2015
200%
0
0
-
-
-
FLAT H
Saleable(sqft)
Gross(sqft)
Price
Year
Gain/Loss
631
780
$1.9M
1996
-
631
0
-
-
-
631
850
-
-
-
631
850
-
-
-
631
0
$6.5M
2024
-
631
0
$2.26M
1995
-
631
0
-
-
-
631
0
$5.82M
2013
-
631
0
$4.53M
2010
62%
631
0
-
-
-
631
830
$2.5M
2006
-
631
950
$2.9M
1997
-
631
0
-
-
-
631
0
-
-
-
631
800
-
-
-
631
680
$7.15M
2017
322%
631
0
-
-
-
FLAT I
Saleable(sqft)
Gross(sqft)
Price
Year
Gain/Loss
529
0
$4.4M
2013
-
529
0
-
-
-
0
750
$1.98M
2007
21%
529
0
$1.75M
1996
-
529
0
$1.92M
1997
-
529
650
-
-
-
529
0
-
-
-
529
0
-
-
-
529
700
$990K
2003
-
529
0
-
-
-
529
0
$1.72M
1996
-
529
548
$1.35M
2000
27%
529
0
$6M
2015
280%
529
0
-
-
-
529
0
$5.03M
2017
-
529
0
$1.23M
1999
-
FLAT J
Saleable(sqft)
Gross(sqft)
Price
Year
Gain/Loss
529
600
$3.48M
2010
17%
529
0
-
-
-
529
0
-
-
-
529
0
$1.5M
2004
14%
529
850
$2.7M
2009
170%
529
0
$4.05M
2011
36%
0
0
-
-
-
0
0
-
-
-
529
0
$5.75M
2015
123%
0
0
-
-
-
0
0
-
-
-
529
0
$1.15M
2004
25%
529
0
$5.24M
2013
162%
529
0
-
-
-
529
0
-
-
-
529
0
-
-
-
FLAT K
Saleable(sqft)
Gross(sqft)
Price
Year
Gain/Loss
488
0
$2.8M
2010
-
488
0
-
-
-
488
0
-
-
-
488
0
-
-
-
488
150
-
-
-
488
0
-
-
-
488
0
-
-
-
488
0
-
-
-
488
0
$4.05M
2012
121%
488
0
$1.16M
2002
-
488
0
-
-
-
488
540
-
-
-
488
0
-
-
-
488
700
$1.77M
1998
12%
488
0
$5.8M
2018
-
488
0
-
-
-
Relevant News
No Result Found