
Ho Fat Building
Price/ sq.ft. by trans. (S.A.) inMar
-
Transactions Volume
-
Price by trans
-
Price/ sq.ft. by trans. (S.A.)
-
Price by listing
$2.5M
-$4.88M
Price sq.ft. by listing
$9,470
-$18,485
/sq.ft.Buy3
Rent/ sq.ft. by trans. (S.A.) inMar
-
Rent Volume
-
Rent Price by trans
-
Rent/ sq.ft. by trans. (S.A.)
-
Rent by listing
-
Rent sq.ft. by listing
-


Ho Fat Building
Estate Info
Estate Overview
Date of Occupation Permit
1980-10-1980-10
No. of Phases
-
No. of Blocks
1 Block(s)
Total units
104
Walking toLong PingStation
12 Min(s)
Address/ Area
18 SAI YU STREET
School Net
Property Management Company
-
Category
-
Developer
-
Other Facilities
-
Ho Fat Building
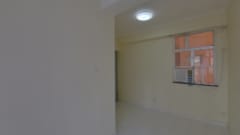
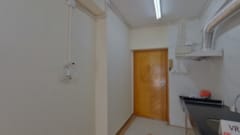
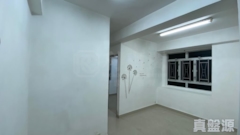
Location
Ho Fat Building
Recommendation

HO FAT BUILDING1Rooms
Saleable
264sq.ft.
Gross
353sq.ft.
$
2.5 M
HO FAT BUILDING1Rooms
Saleable
264sq.ft.
Gross
353sq.ft.
$
2.5 M
HO FAT BUILDING2Rooms2Living Room(s)
Saleable
264sq.ft.
Gross
353sq.ft.
$
4.88 M
HO FAT BUILDING2Rooms2Living Room(s)
Saleable
264sq.ft.
Gross
353sq.ft.
$
4.88 M
HO FAT BUILDING1Rooms
Saleable
264sq.ft.
Gross
353sq.ft.
$
2.9 M
HO FAT BUILDING1Rooms
Saleable
264sq.ft.
Gross
353sq.ft.
$
2.9 M
Ho Fat Building
Transaction
 Data currently unavailable
Transaction History
Floor/ Room
FLOOR 13
FLOOR 12
FLOOR 11
FLOOR 10
FLOOR 9
FLOOR 8
FLOOR 7
FLOOR 6
FLOOR 5
FLOOR 4
FLOOR 3
FLOOR 2
FLOOR 1
FLAT A
Saleable(sqft)
Gross(sqft)
Price
Year
Gain/Loss
260
332
$2.88M
2023
2%
0
0
-
-
-
260
332
$3.8M
2018
54%
260
332
$2.35M
2016
86%
260
332
$450K
2007
46%
0
332
-
-
-
0
332
-
-
-
260
0
$2.03M
2013
-
260
332
$2.92M
2023
461%
260
332
$3.4M
2020
162%
260
332
$362K
2003
13%
260
332
$1.85M
2013
48%
0
332
-
-
-
FLAT B
Saleable(sqft)
Gross(sqft)
Price
Year
Gain/Loss
260
332
$4.08M
2018
163%
260
332
$3.76M
2018
62%
0
332
$380K
2002
-
260
332
$2.72M
2017
43%
0
332
-
-
-
0
0
-
-
-
0
0
-
-
-
260
332
$3.45M
2021
66%
260
332
$535K
2006
16%
260
332
$2.53M
2015
130%
260
332
$1.47M
2012
139%
0
332
$548K
1996
-
260
332
$3.5M
2019
50%
FLAT C
Saleable(sqft)
Gross(sqft)
Price
Year
Gain/Loss
264
353
$400K
2002
-
264
353
$450K
2004
63%
0
353
$950K
1997
18%
264
353
$2.65M
2015
165%
264
353
$3.95M
2019
30%
264
353
$2.65M
2015
77%
264
353
$3M
2022
-
264
0
$1.59M
2012
-
264
353
-
-
-
264
353
$3.15M
2020
223%
0
353
-
-
-
264
353
$590K
2009
27%
264
353
$750K
2000
19%
FLAT D
Saleable(sqft)
Gross(sqft)
Price
Year
Gain/Loss
264
353
$495K
2005
10%
264
353
$3.88M
2021
23%
264
400
$2.5M
2015
95%
264
353
$523K
2007
5%
0
353
-
-
-
0
353
-
-
-
264
353
$1.89M
2014
62%
264
353
$670K
2009
41%
264
353
$3.02M
2019
38%
0
0
-
-
-
264
353
$765K
2009
22%
0
353
$450K
2001
55%
264
353
$2.9M
2013
63%
FLAT E
Saleable(sqft)
Gross(sqft)
Price
Year
Gain/Loss
260
332
$660K
2007
5%
260
332
$780K
2008
15%
0
0
-
-
-
260
332
$3.7M
2021
97%
260
332
$680K
2008
33%
0
332
$739.8K
1998
41%
260
332
$3.48M
2018
46%
0
332
$400K
2003
15%
0
332
$600K
1996
-
260
332
$1.9M
2013
228%
260
332
$1.85M
2013
105%
260
332
$1.82M
2012
114%
260
332
$380K
2003
47%
FLAT F
Saleable(sqft)
Gross(sqft)
Price
Year
Gain/Loss
260
332
$580K
2000
-
0
332
$575K
1996
-
0
332
$900K
1997
33%
260
332
$3.4M
2022
12%
260
332
$1.4M
2011
31%
260
332
$3.19M
2017
190%
260
332
$1.59M
2012
205%
260
332
$3.58M
2022
43%
0
0
-
-
-
0
0
-
-
-
260
0
$3.45M
2021
62%
260
332
$370K
2002
36%
260
332
$490K
2007
33%
FLAT G
Saleable(sqft)
Gross(sqft)
Price
Year
Gain/Loss
264
353
$1.18M
2010
74%
264
353
$900K
2010
76%
264
353
$3.5M
2020
-
264
353
$1.2M
2011
-
264
353
$490K
2006
12%
0
0
-
-
-
264
353
$470K
2001
31%
0
353
$740K
1999
7%
264
353
$2.58M
2015
345%
0
353
-
-
-
0
353
-
-
-
0
353
-
-
-
0
0
-
-
-
Relevant News
No Result Found