
Yik Hon Building
Price/ sq.ft. by trans. (S.A.) inMar
$13,220/sq.ft.
Transactions Volume
1Record(s)
Price by trans
$3.9M
-$3.9M
Price/ sq.ft. by trans. (S.A.)
$13,220
-$13,220
/sq.ft.Price by listing
$4.5M
-$5.6M
Price sq.ft. by listing
$14,286
-$18,983
/sq.ft.Buy8
Rent/ sq.ft. by trans. (S.A.) inMar
-
Rent Volume
-
Rent Price by trans
-
Rent/ sq.ft. by trans. (S.A.)
-
Rent by listing
-
Rent sq.ft. by listing
-


Yik Hon Building
Estate Info
Estate Overview
Date of Occupation Permit
1975-11-1975-11
No. of Phases
-
No. of Blocks
1 Block(s)
Total units
126
Walking toNorth PointStation
2 Min(s)
Address/ Area
72-78 JAVA ROAD
School Net
Property Management Company
-
Category
-
Developer
-
Other Facilities
-
Yik Hon Building
Location
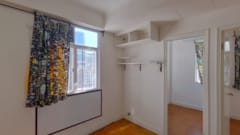
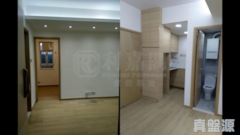
Yik Hon Building
Recommendation
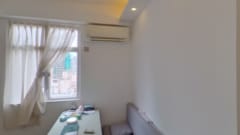

YIK HON BUILDING2Rooms2Living Room(s)
Saleable
315sq.ft.
Gross
390sq.ft.
$
4.68 M
YIK HON BUILDING2Rooms2Living Room(s)
Saleable
315sq.ft.
Gross
390sq.ft.
$
4.68 M
YIK HON BUILDING2Rooms
Saleable
315sq.ft.
Gross
381sq.ft.
$
4.6 M
YIK HON BUILDING2Rooms
Saleable
315sq.ft.
Gross
381sq.ft.
$
4.6 M

YIK HON BUILDING2Rooms1Living Room(s)
Saleable
295sq.ft.
Gross
344sq.ft.
$
5.6 M
YIK HON BUILDING2Rooms1Living Room(s)
Saleable
295sq.ft.
Gross
344sq.ft.
$
5.6 M

YIK HON BUILDING1Rooms1Living Room(s)
Saleable
295sq.ft.
Gross
344sq.ft.
$
4.98 M
YIK HON BUILDING1Rooms1Living Room(s)
Saleable
295sq.ft.
Gross
344sq.ft.
$
4.98 M

YIK HON BUILDING2Rooms1Living Room(s)
Saleable
295sq.ft.
Gross
344sq.ft.
$
4.88 M
YIK HON BUILDING2Rooms1Living Room(s)
Saleable
295sq.ft.
Gross
344sq.ft.
$
4.88 M

YIK HON BUILDING1Rooms1Living Room(s)
Saleable
315sq.ft.
Gross
381sq.ft.
$
4.5 M
YIK HON BUILDING1Rooms1Living Room(s)
Saleable
315sq.ft.
Gross
381sq.ft.
$
4.5 M
YIK HON BUILDING1Rooms
Saleable
295sq.ft.
Gross
344sq.ft.
$
5.2 M
YIK HON BUILDING1Rooms
Saleable
295sq.ft.
Gross
344sq.ft.
$
5.2 M

YIK HON BUILDING2Rooms2Living Room(s)
Saleable
369sq.ft.
Gross
450sq.ft.
$
5.4 M
YIK HON BUILDING2Rooms2Living Room(s)
Saleable
369sq.ft.
Gross
450sq.ft.
$
5.4 M
Yik Hon Building
Transaction
 Data currently unavailable
Transaction History
Floor/ Room
FLOOR 22
FLOOR 21
FLOOR 20
FLOOR 19
FLOOR 18
FLOOR 17
FLOOR 16
FLOOR 15
FLOOR 14
FLOOR 13
FLOOR 12
FLOOR 11
FLOOR 10
FLOOR 9
FLOOR 8
FLOOR 7
FLOOR 6
FLOOR 5
FLOOR 4
FLOOR 3
FLOOR 2
FLAT A
Saleable(sqft)
Gross(sqft)
Price
Year
Gain/Loss
295
344
$830K
2004
29%
295
410
$1M
2006
23%
295
344
$590K
2003
61%
295
344
-
-
-
295
344
$3.6M
2014
114%
295
344
$4.1M
2016
91%
0
344
-
-
-
0
344
$1.29M
1996
-
0
344
-
-
-
0
344
$1.3M
1999
-
295
344
$3.6M
2014
80%
0
344
$1.46M
1998
17%
295
344
$3.7M
2016
161%
295
360
-
-
-
295
400
$4.82M
2019
338%
295
375
$2.08M
2010
20%
295
344
-
-
-
295
344
$2.83M
2011
44%
295
344
$4.73M
2018
101%
295
344
$5M
2023
241%
295
344
$5.15M
2021
15%
FLAT B
Saleable(sqft)
Gross(sqft)
Price
Year
Gain/Loss
295
344
$2.06M
2010
-
295
344
-
-
-
295
344
-
-
-
295
344
$1.28M
1996
-
295
344
-
-
-
295
344
-
-
-
295
344
$1.15M
2005
21%
295
344
$4.95M
2018
168%
295
344
$5.18M
2021
38%
0
344
$1.46M
1996
-
295
344
$1.99M
2010
8%
295
344
$3.9M
2024
319%
0
344
-
-
-
0
344
-
-
-
295
344
$1.07M
2005
11%
295
344
$2.2M
2010
22%
295
344
$3.18M
2013
61%
0
344
-
-
-
0
344
-
-
-
295
344
$3.8M
2018
-
295
344
-
-
-
FLAT C
Saleable(sqft)
Gross(sqft)
Price
Year
Gain/Loss
369
460
$1.45M
2007
26%
369
450
-
-
-
369
450
-
-
-
369
450
$1.75M
2010
-
369
450
$1.55M
1999
-
369
450
-
-
-
369
450
$3.8M
2012
64%
369
450
$1.56M
1998
18%
0
450
-
-
-
0
450
-
-
-
369
450
$5.22M
2018
324%
0
450
$1.72M
1998
-
0
450
-
-
-
0
450
-
-
-
0
450
-
-
-
0
450
-
-
-
369
450
$3.93M
2013
92%
369
450
$4.62M
2017
-
369
450
$1.42M
1996
-
369
400
-
-
-
369
450
$4.4M
2014
225%
FLAT D
Saleable(sqft)
Gross(sqft)
Price
Year
Gain/Loss
369
450
$2.38M
2010
29%
369
450
$4.64M
2015
342%
369
450
-
-
-
369
450
$808K
2003
15%
369
450
$1M
1999
-
369
450
-
-
-
369
450
-
-
-
369
450
$5.6M
2019
-
369
450
$5.68M
2020
-
369
450
$5.5M
2019
17%
369
450
-
-
-
369
450
-
-
-
369
450
$3.88M
2014
159%
369
450
$1.75M
2009
-
369
450
-
-
-
369
450
$5.6M
2018
-
369
450
-
-
-
369
450
$3.2M
2012
52%
369
450
-
-
-
369
450
$493K
2003
70%
369
450
-
-
-
FLAT E
Saleable(sqft)
Gross(sqft)
Price
Year
Gain/Loss
315
390
$3.29M
2012
106%
315
390
$1.03M
2005
24%
315
381
$1.26M
1998
-
315
381
$3M
2014
-
315
381
$1.19M
2007
-
315
390
$1.15M
1998
-
315
381
$1.94M
1997
-
315
381
$3.98M
2015
-
315
364
$890K
2001
-
315
364
$1.82M
2010
56%
315
381
-
-
-
315
381
-
-
-
315
381
$4.5M
2023
75%
315
390
$4.95M
2018
175%
315
381
-
-
-
315
364
$2.92M
2012
86%
315
500
$818K
2004
-
315
400
-
-
-
315
390
$1.11M
2007
63%
315
390
$1.05M
2007
14%
315
381
-
-
-
FLAT F
Saleable(sqft)
Gross(sqft)
Price
Year
Gain/Loss
315
400
$3.78M
2016
86%
315
400
$3.5M
2014
483%
315
381
-
-
-
315
381
$5.65M
2020
26%
0
381
-
-
-
0
381
-
-
-
0
381
$1.81M
1997
-
315
381
$4.8M
2018
-
0
381
-
-
-
0
381
-
-
-
315
381
$3.04M
2012
-
0
381
-
-
-
0
381
-
-
-
315
381
$4.88M
2020
-
0
381
-
-
-
315
381
$3.95M
2017
-
315
381
-
-
-
315
450
$800K
2005
56%
315
470
$4.32M
2018
476%
315
330
-
-
-
315
381
-
-
-
Relevant News
No Result Found